
I am a guy who reads the nutrition label on a bag of chips like it is a thriller novel, so interesting infographics hit me like an all you can eat buffet. Give me a chart, a map and some colorful bars and I will happily lose a whole afternoon. I came for one fact and stayed for twenty two. Grab a snack, because you are about to learn things you never asked to know.
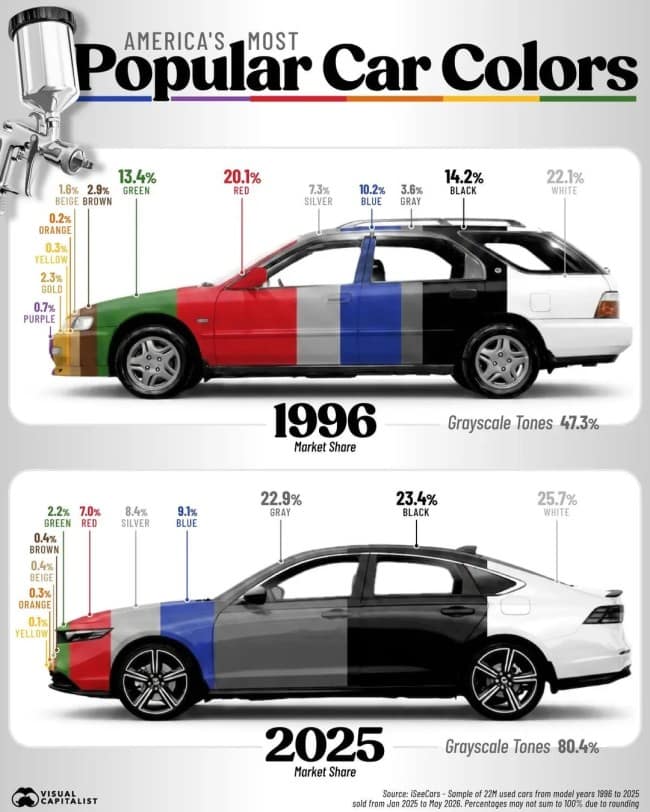
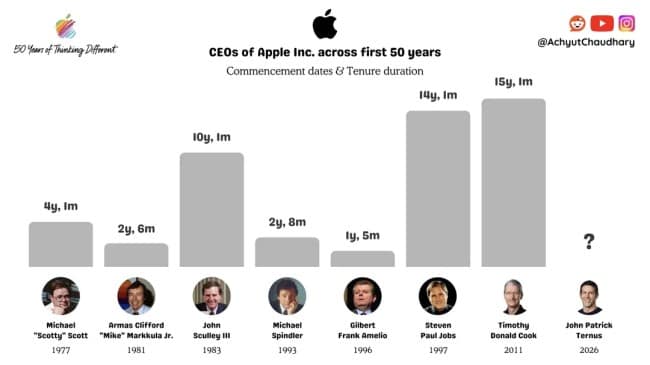
Grayscale won. Fun lost.
Kiss cam not included.
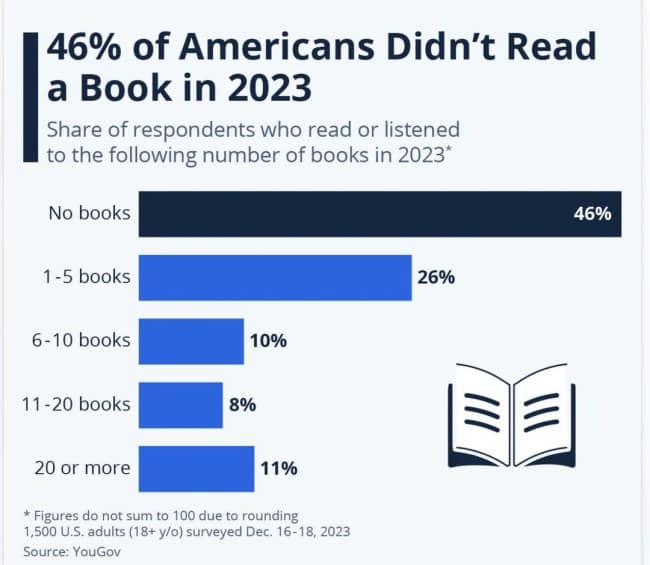
I read the chart. That counts.
Keys sold separately, forever.
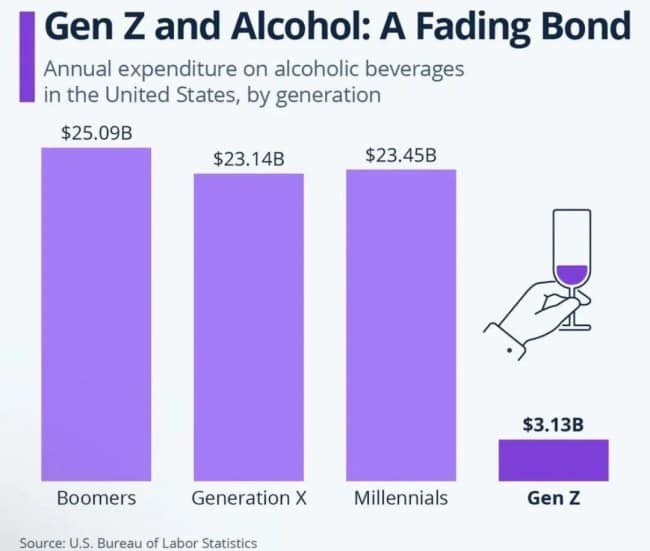
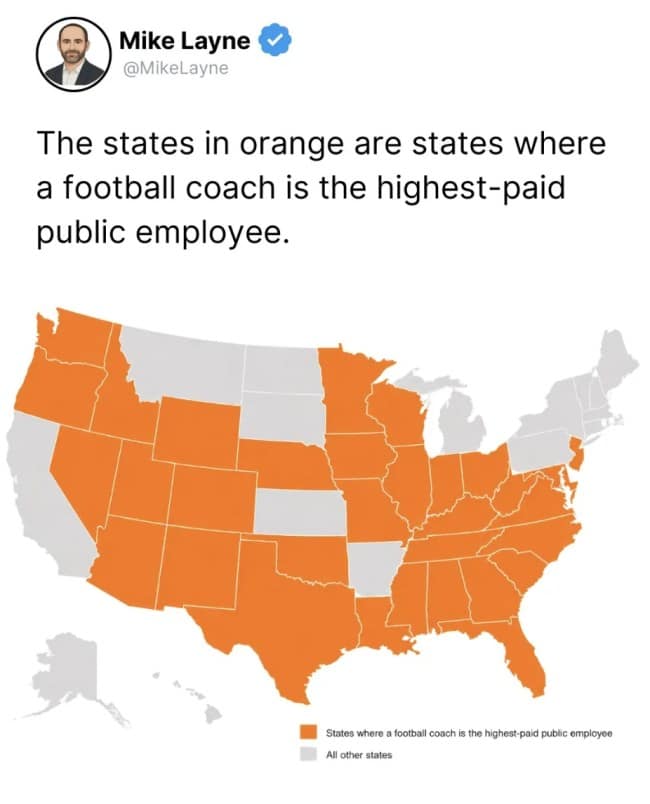
Priorities, in bright orange.
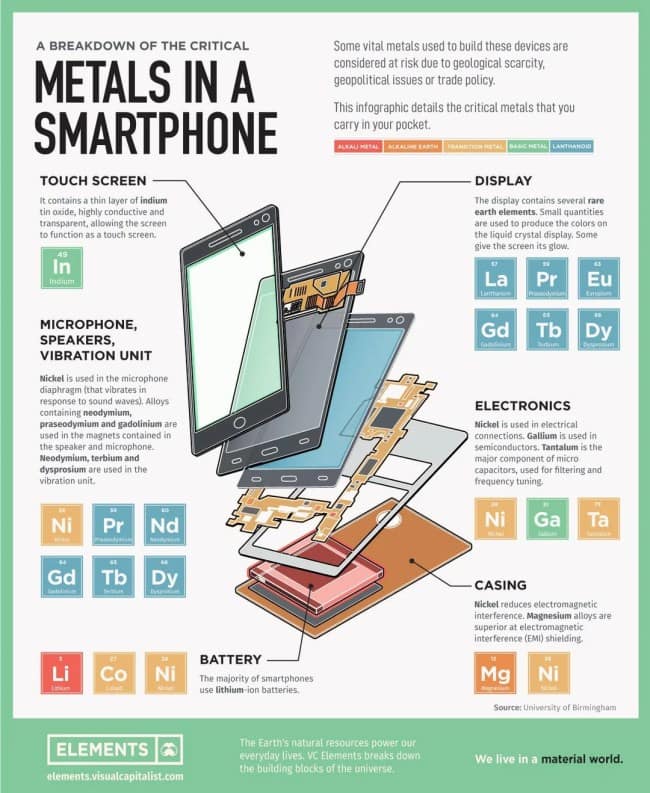

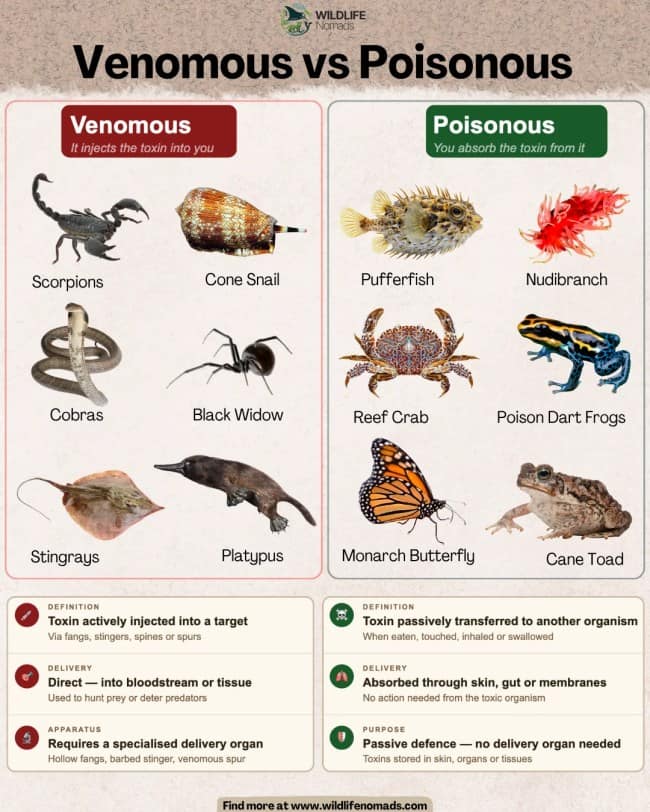
The platypus is doing way too much.
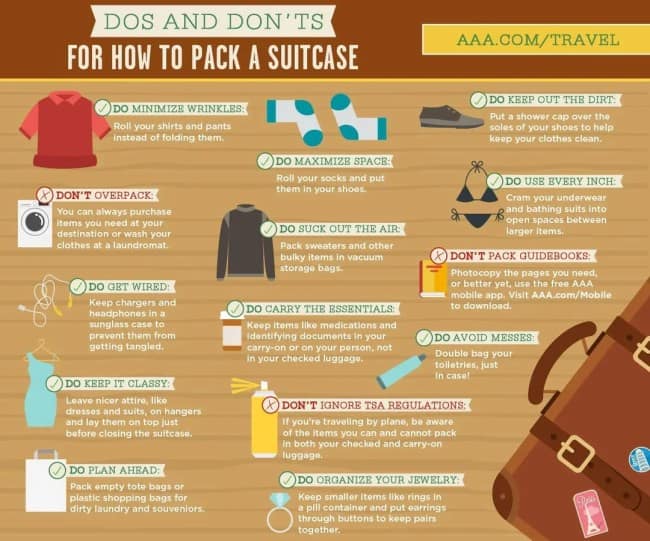
Rolling my socks feels like a personality now.
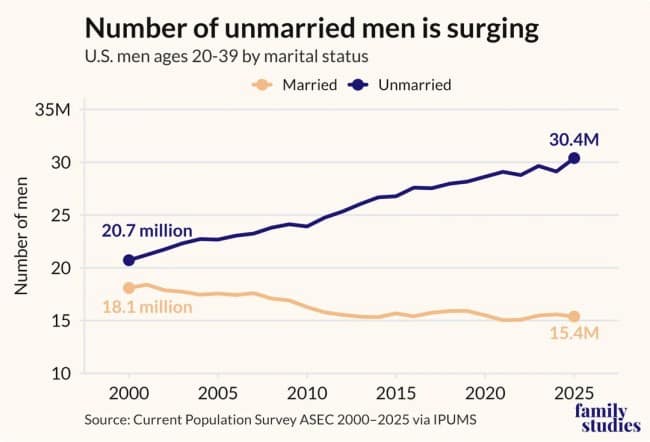
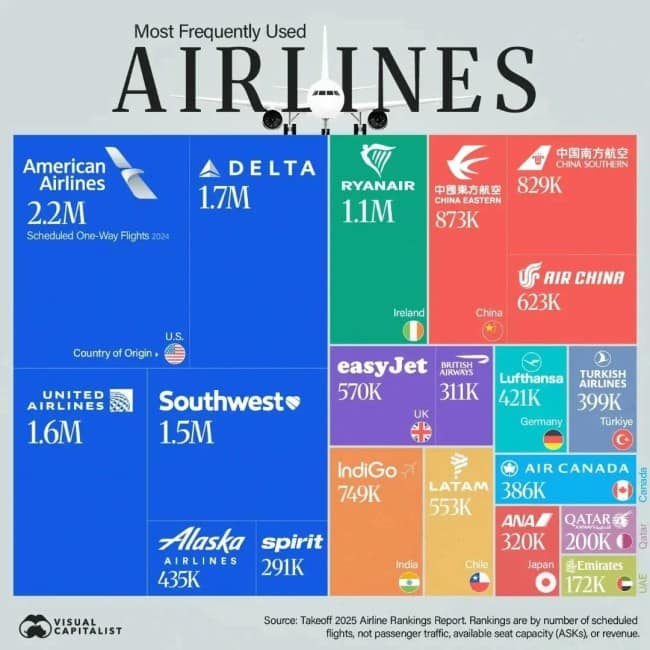
Middle seat, every single time.
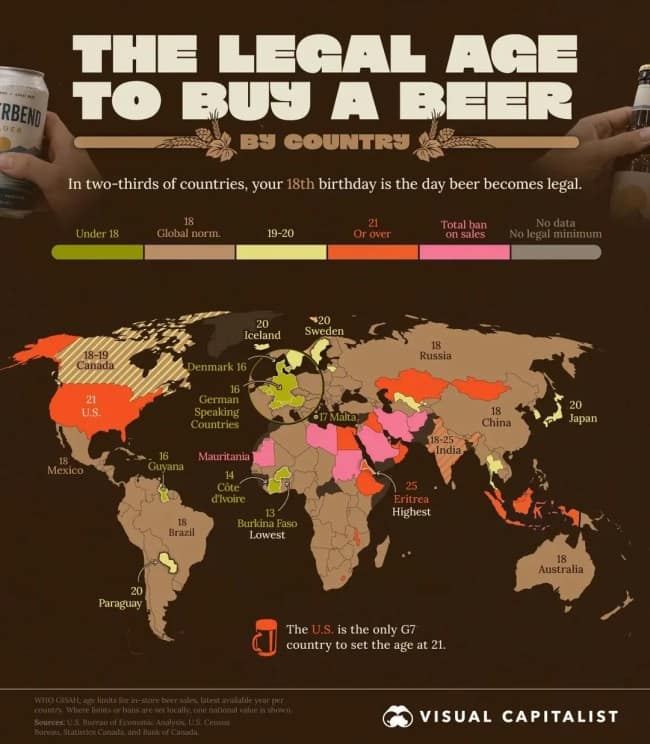



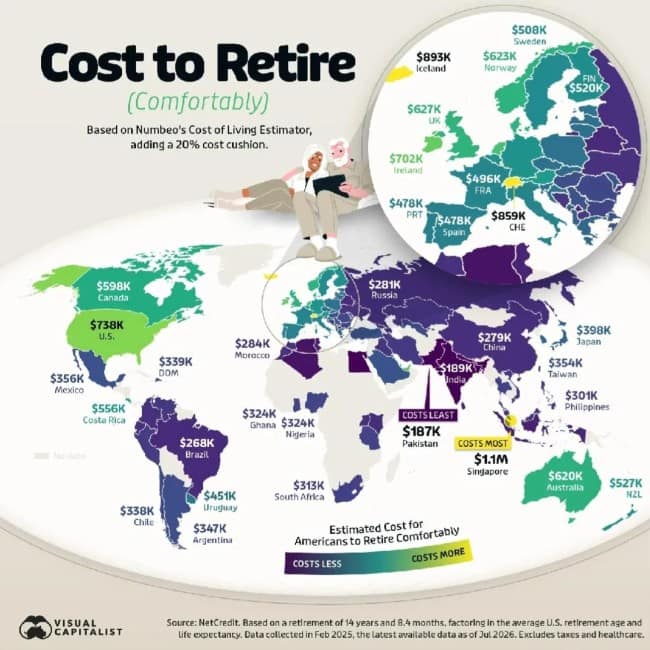
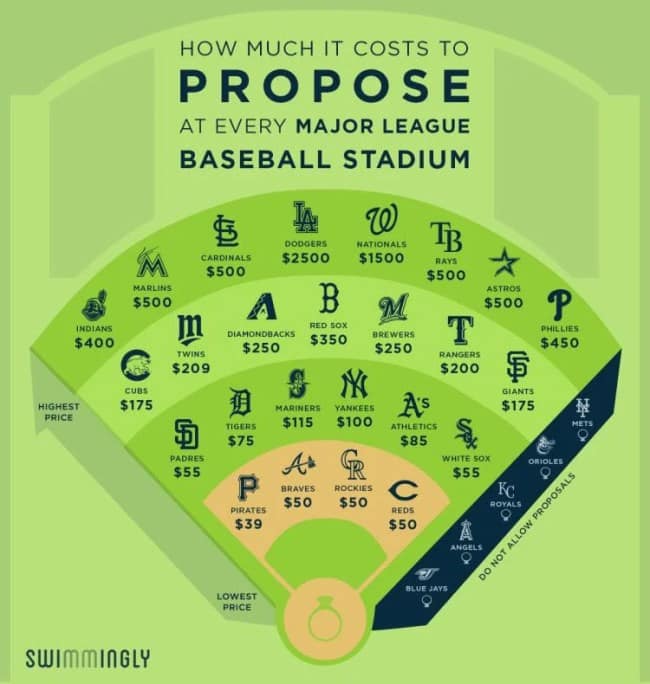
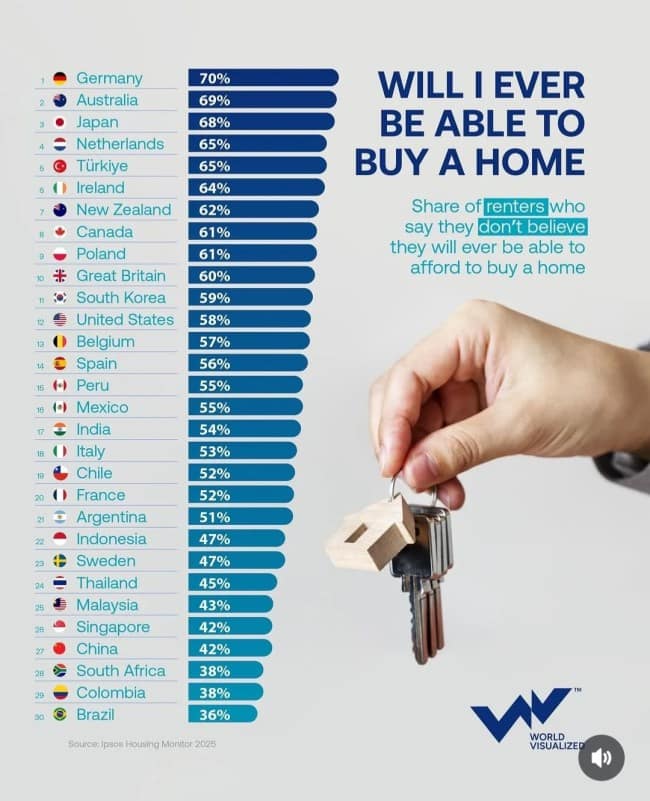
The money ones got me first, because nothing humbles a man like interesting statistics about what everybody else can afford. There are charts about retiring comfortably, buying a home and proposing at a ballpark, and I read every one like a bill I owed. Apparently the cheapest ballpark proposal costs less than the hot dogs I eat at one game, which says a lot about my priorities.
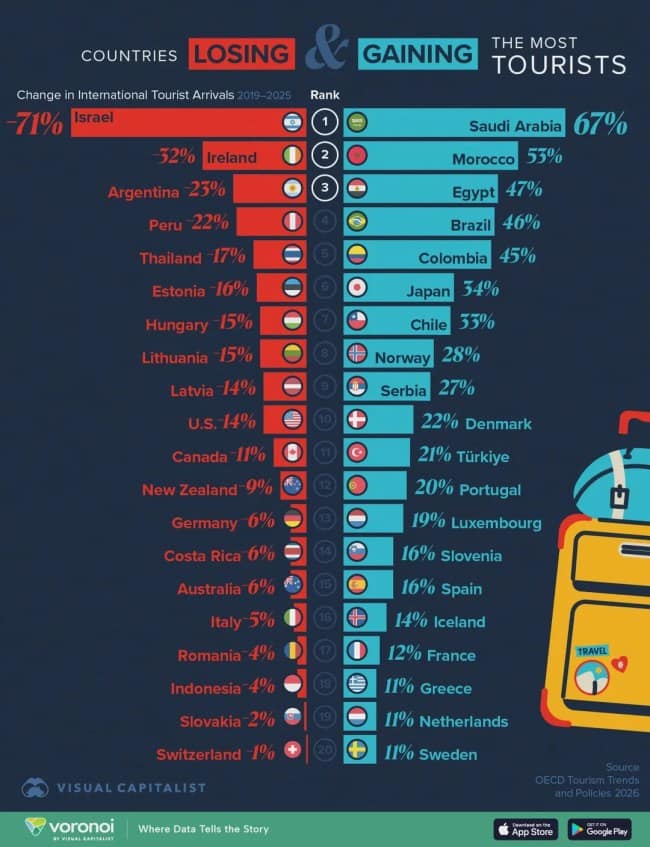
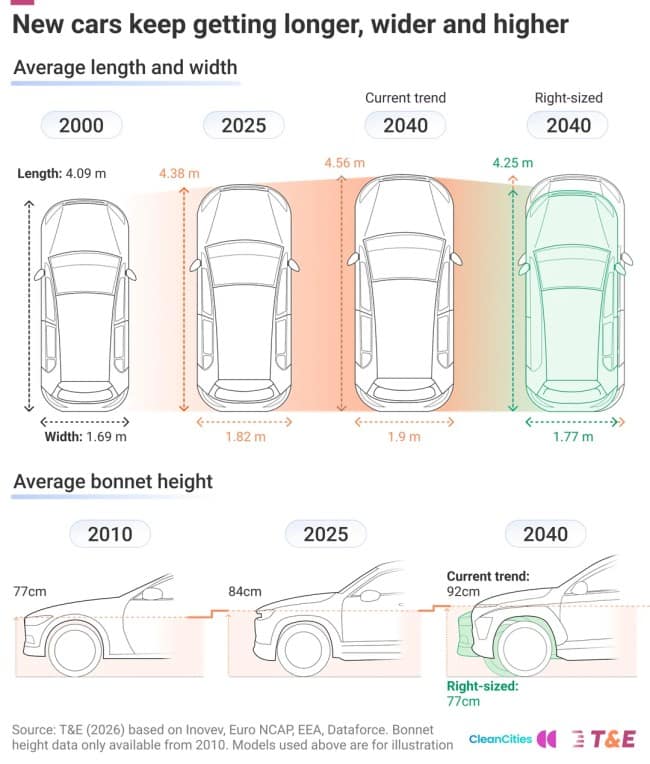
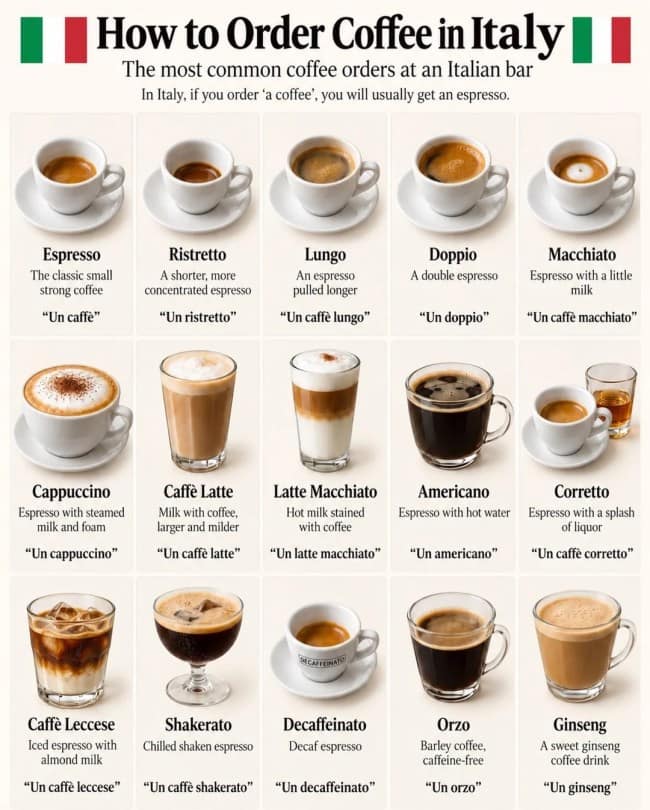
Then the interesting maps and interesting charts turned into pure trivia fuel, which is dangerous for me at parties. I now know how to order fifteen kinds of coffee in Italy, and I cannot wait to get every one of them wrong in person. I also learned new cars keep getting taller, which is the first time anyone has called anything of mine too tall.
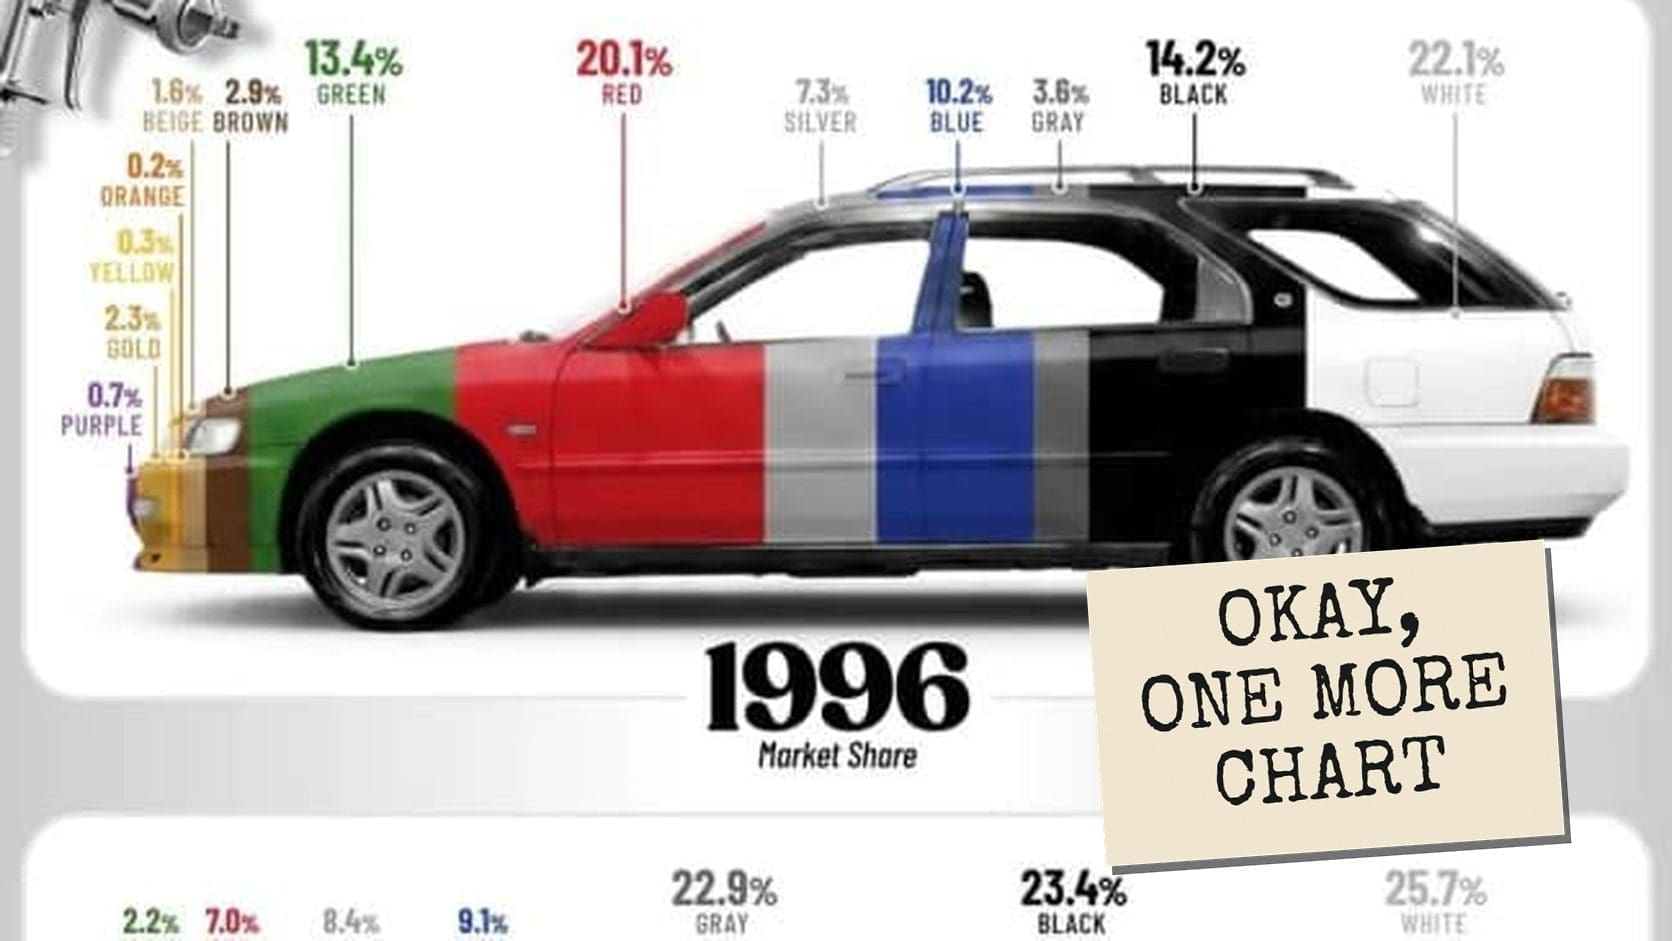
Infographics are basically gossip for people who like numbers. Somebody took a boring spreadsheet, gave it colors and a little cartoon suitcase, and suddenly we are all fighting in the comments about car paint. A fact just goes down easier when it gets dressed up for the party.
The data is in. The charts are pretty. The snacks are gone.
If you are still hungry, These Amazing Maps Have Broken My Internal Globe and I Refuse to Get It Repaired is a full second course. Creative Charts on the Internet Have Officially Diagnosed Every Personal Issue I Was Trying to Hide From Myself is dessert, and a little rude. Bring napkins.
Laura Bennett writes about charts, snacks and other subjects he can discuss for hours at a party that did not ask.
Read Memes
Get Paid


Laura Bennett has spent eight years immersed in internet culture, specializing in deep dives into meme origins, evolving meme trends, and digital subcultures. As a contributor for several prominent online platforms, including BuzzFeed’s meme division and Know Your Meme, she’s written extensively about viral moments from Crying Jordan to Woman Yelling at a Cat. Laura believes memes aren't just internet jokes—they're modern-day folklore. She brings that passion to Thunder Dungeon by keeping readers connected to what's culturally significant, hilarious, and timelessly viral.