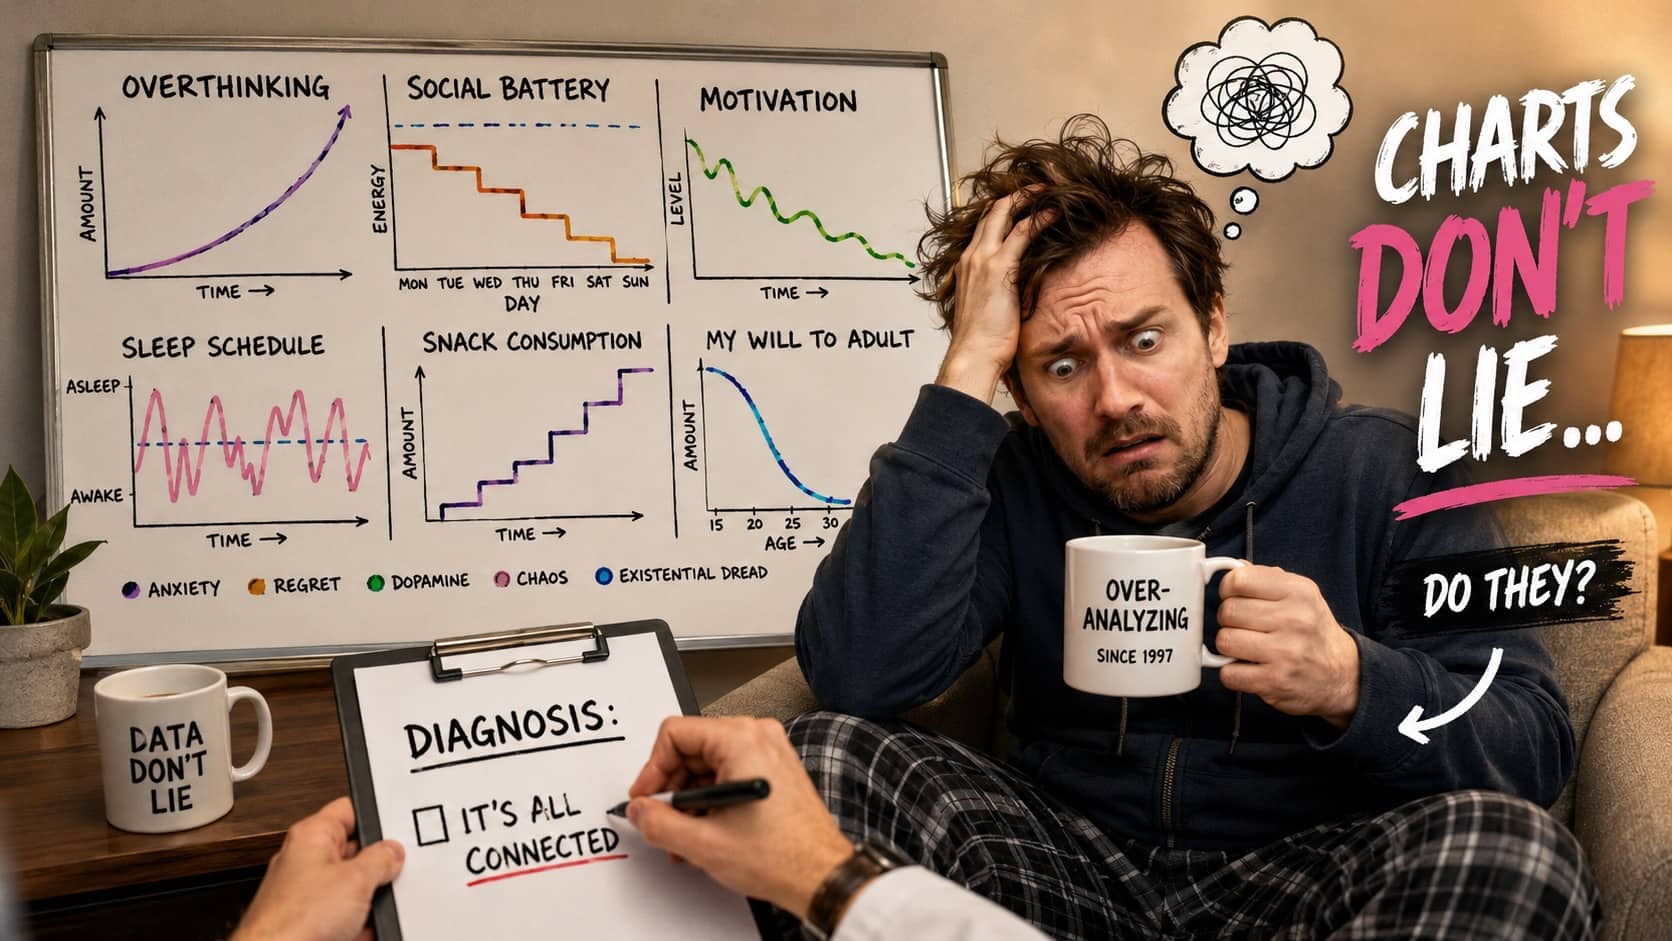
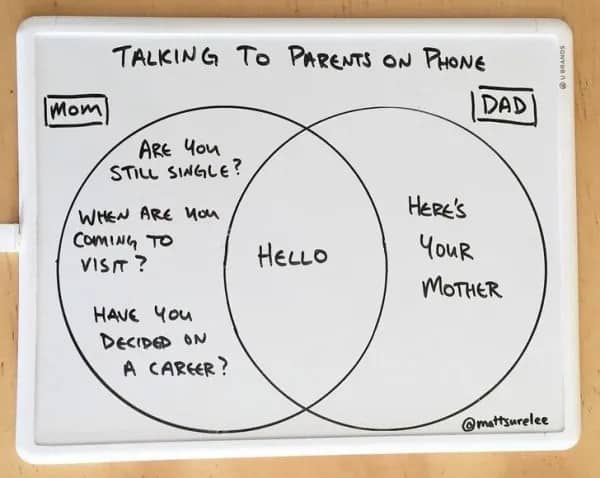
OK here is the thing about Matt Surelee, the comedian behind the whiteboard charts that have been quietly destroying my self-esteem for months now. The man has somehow figured out how to translate the small daily anxieties of modern adult life into hand-drawn graphs and Venn diagrams, and the graphs are, statistically, more accurate than anything my therapist has ever said out loud. These creative charts are the small ongoing record of that exact translation, and the translation is doing real psychological work. Hand me the dry erase marker.
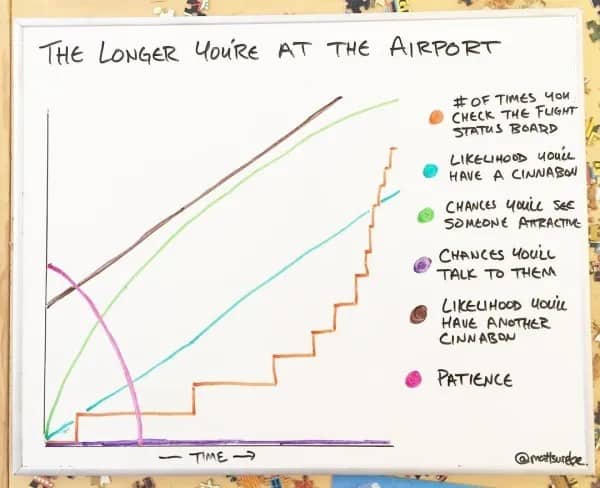
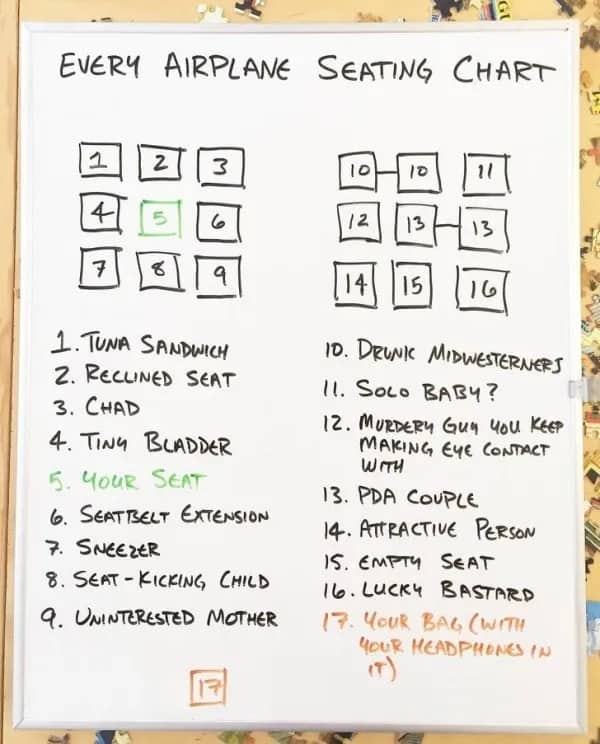
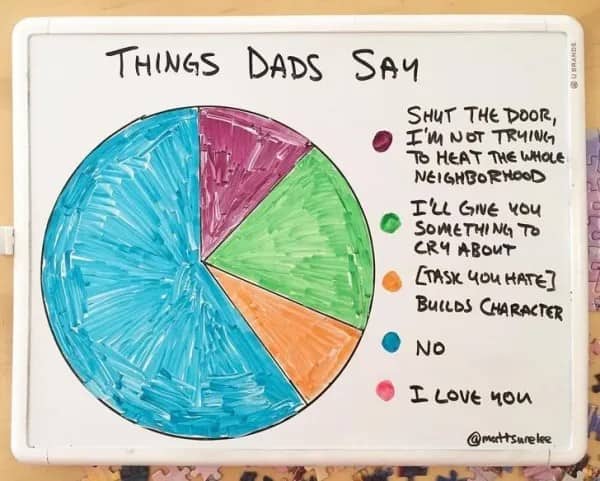
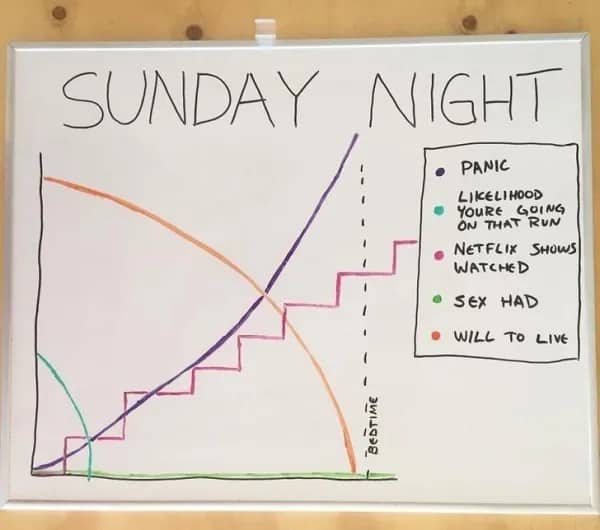
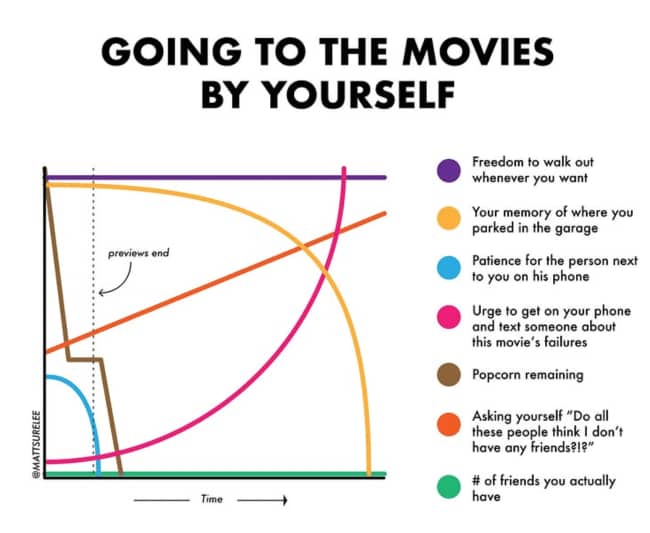
My patience drops faster than my cell service at the gate.
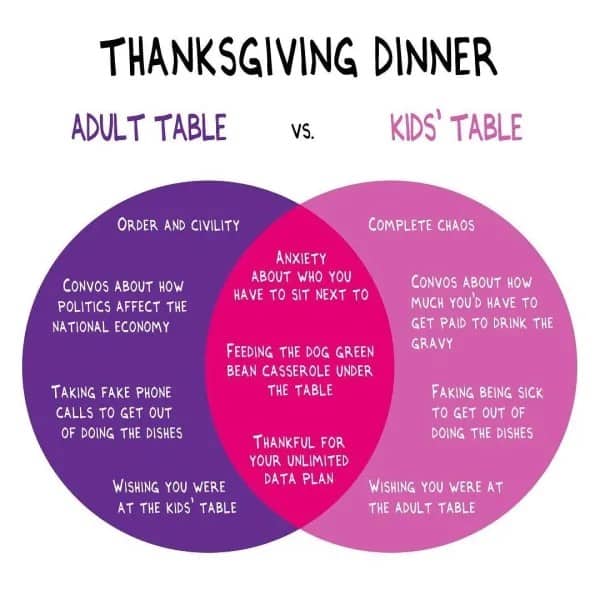
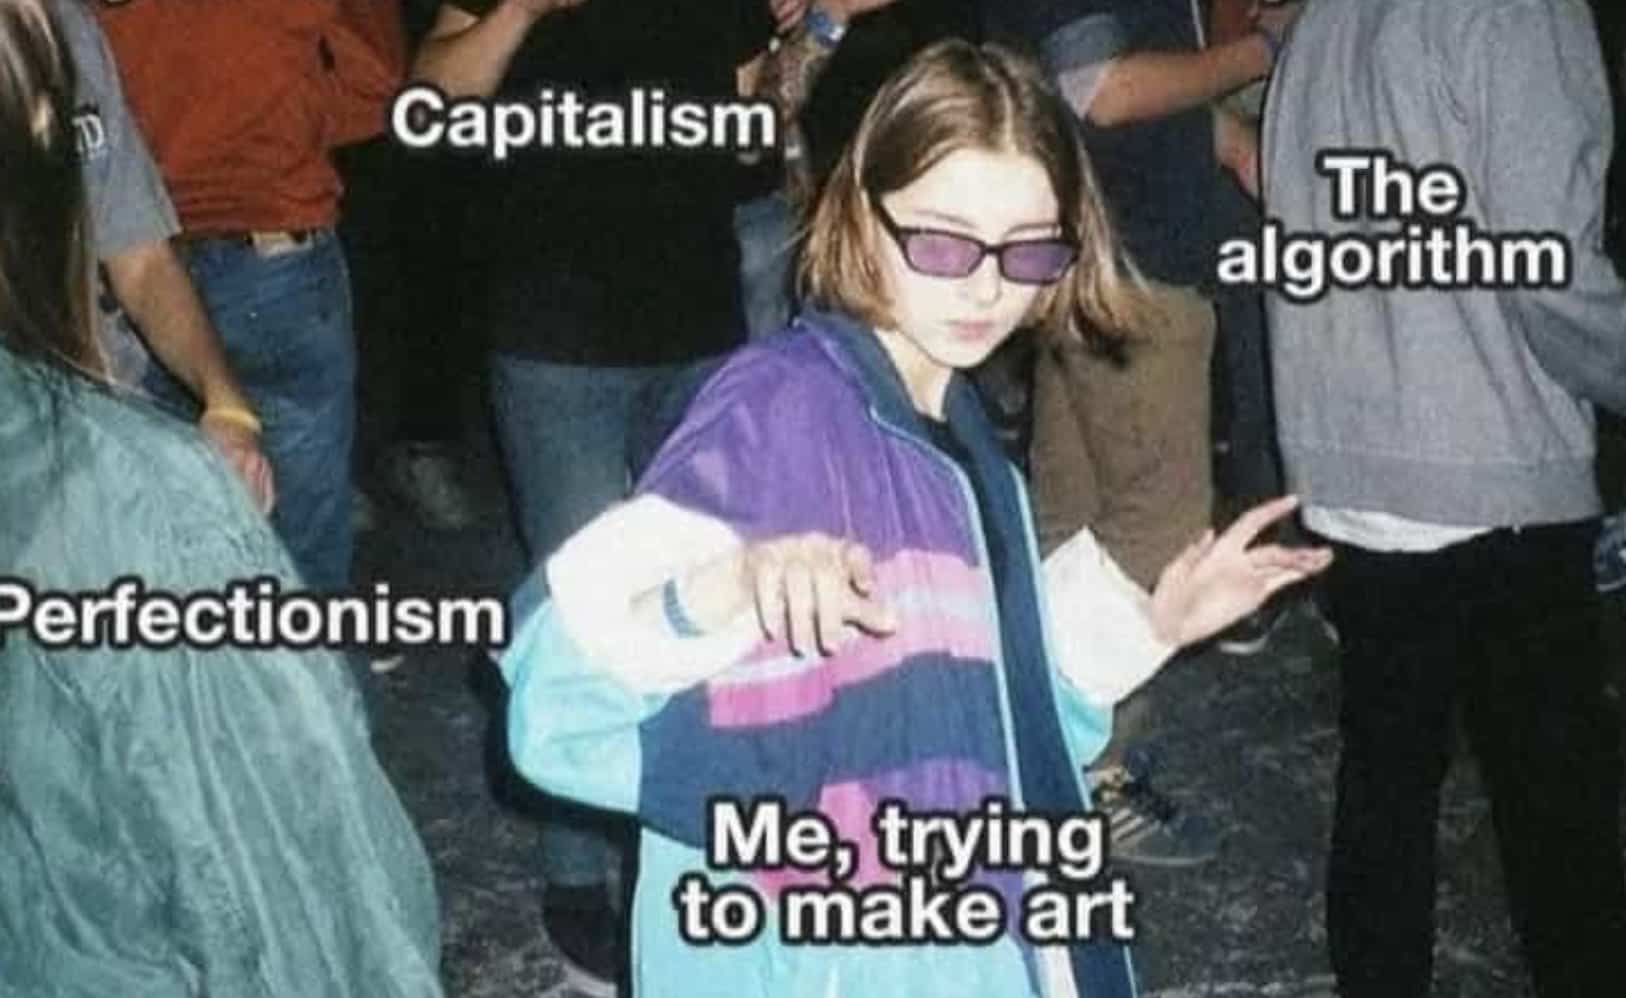
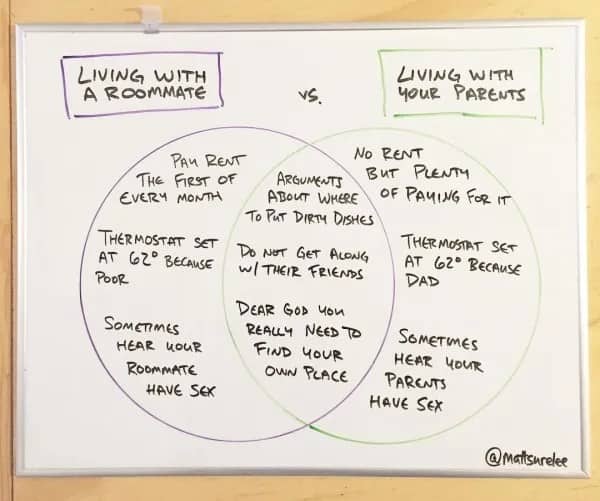
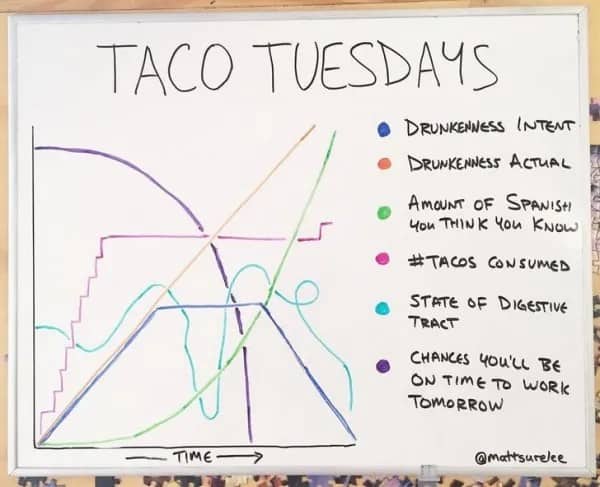
Unlimited data plans are the only thing keeping modern family harmony alive during November.
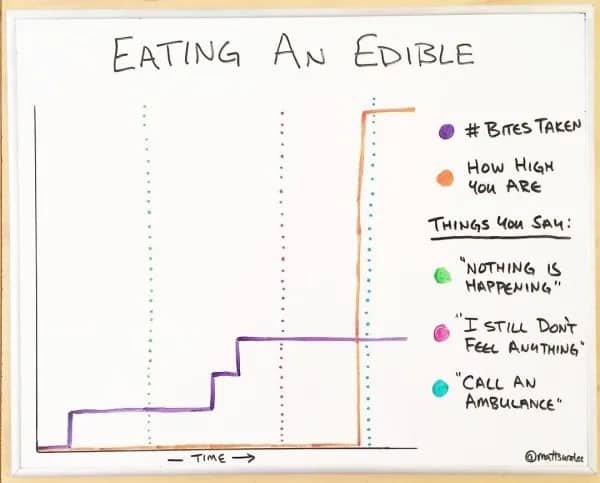
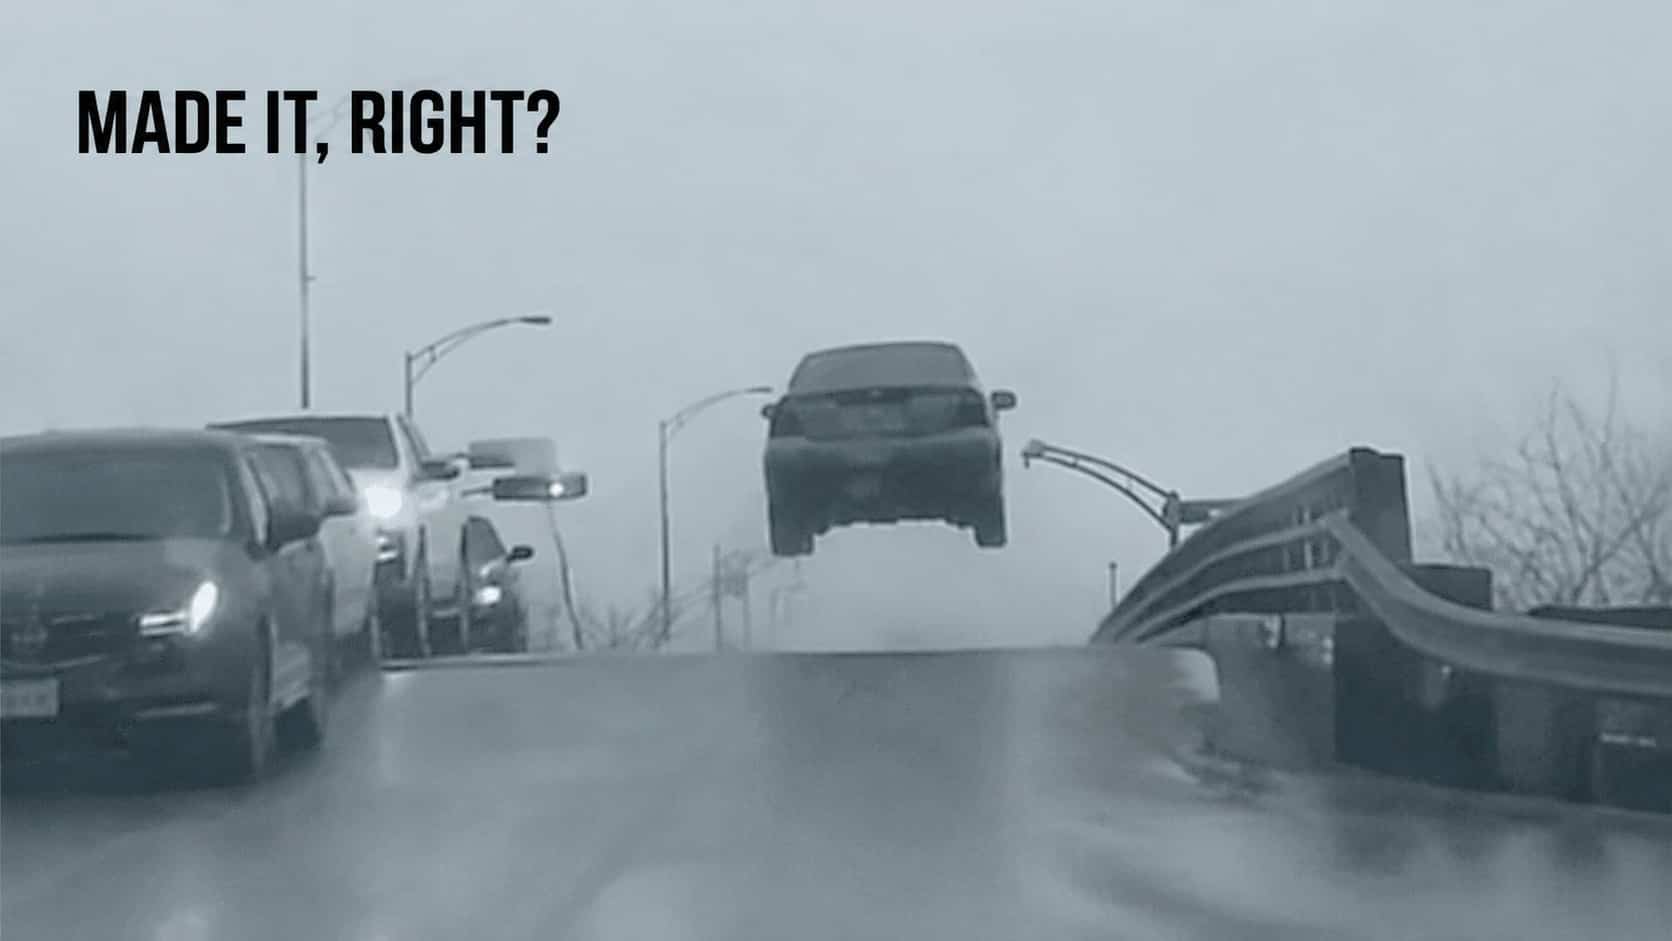
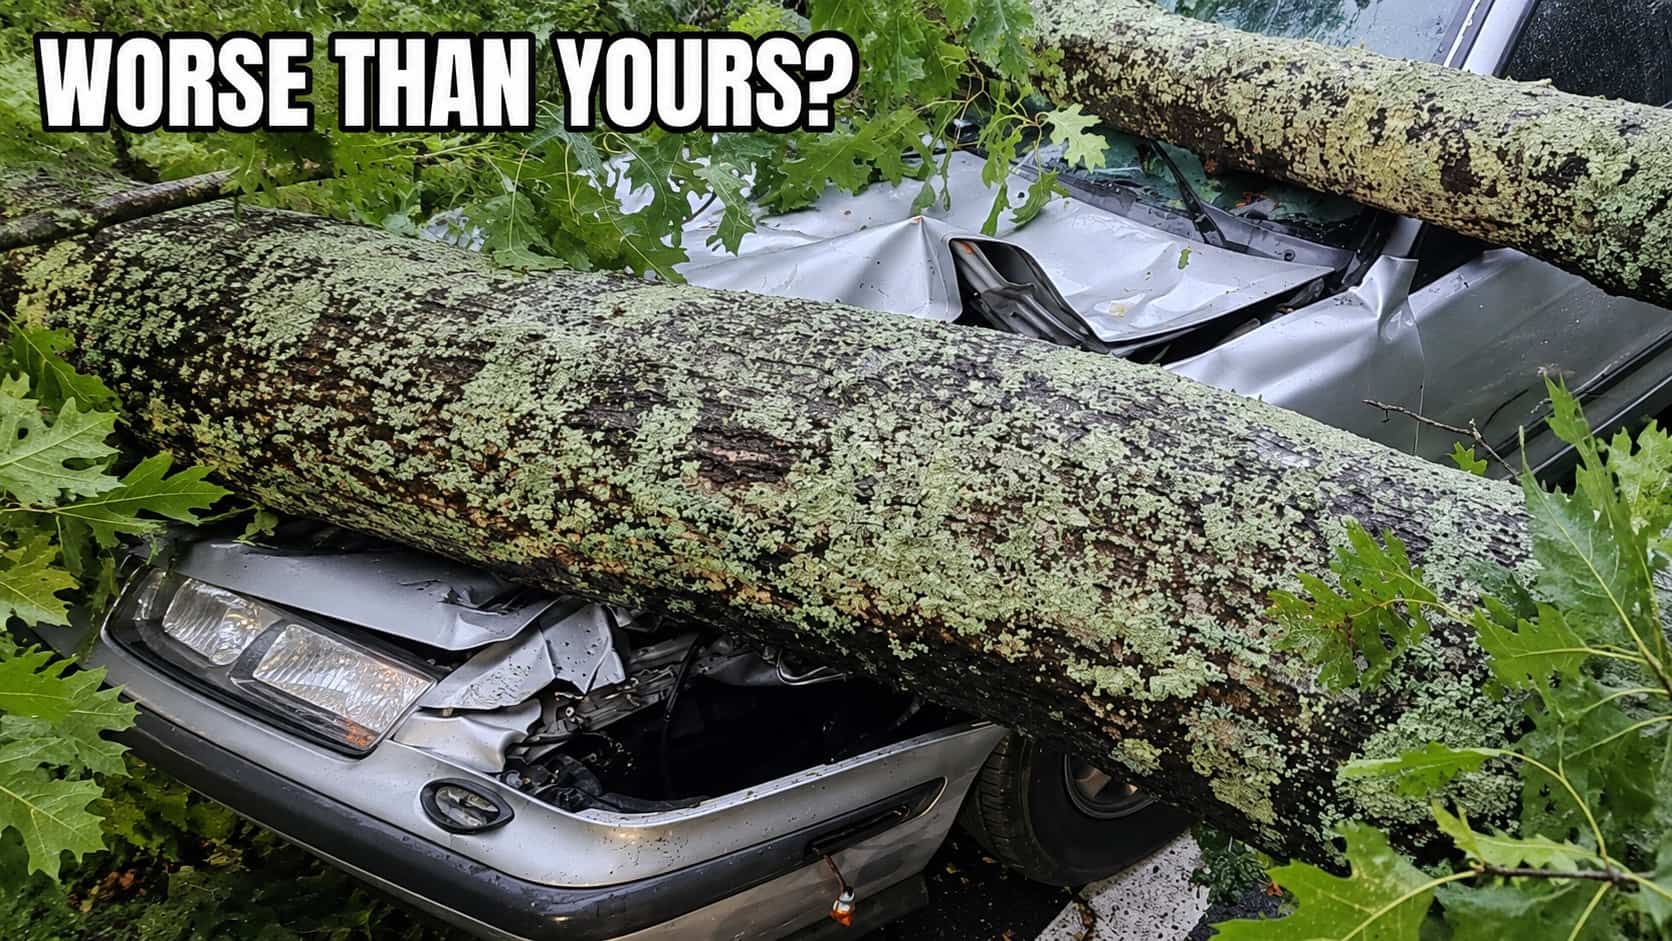
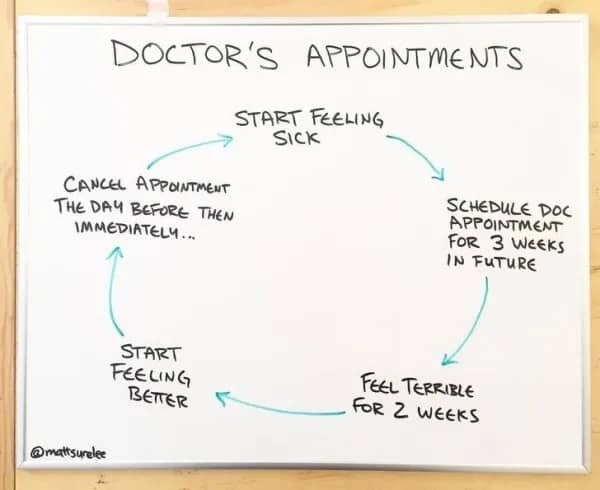
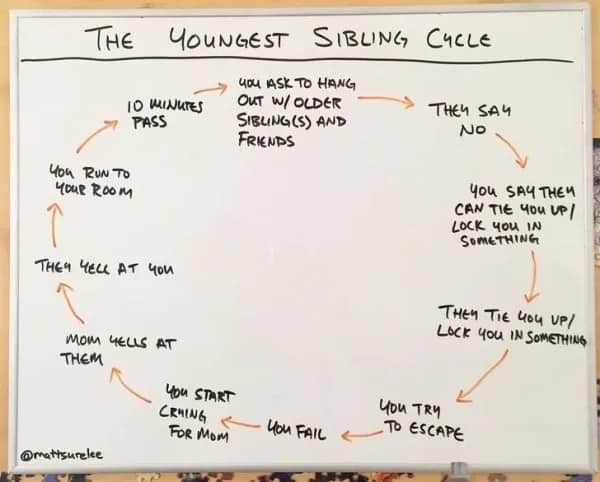
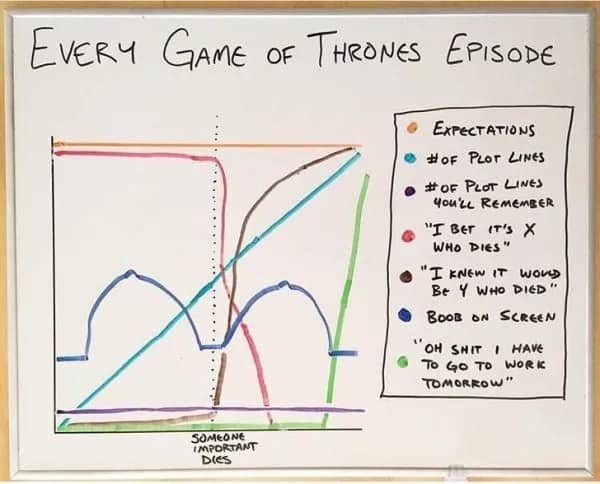
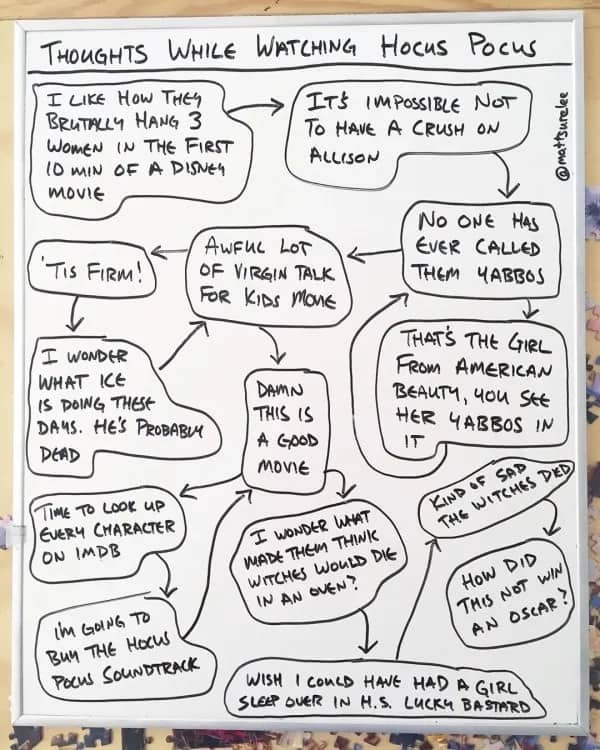
Famous last words before entering another dimension.
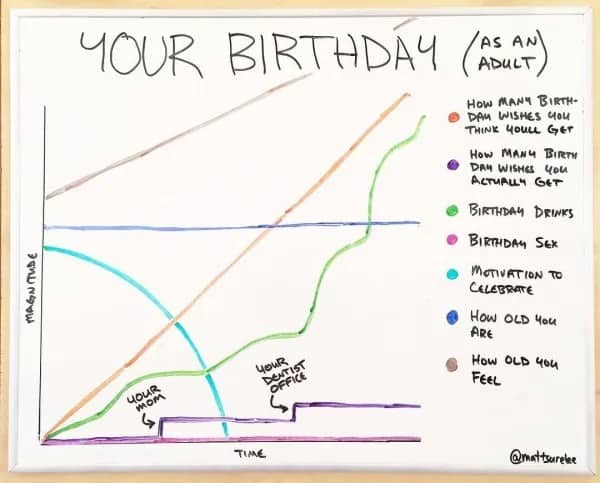
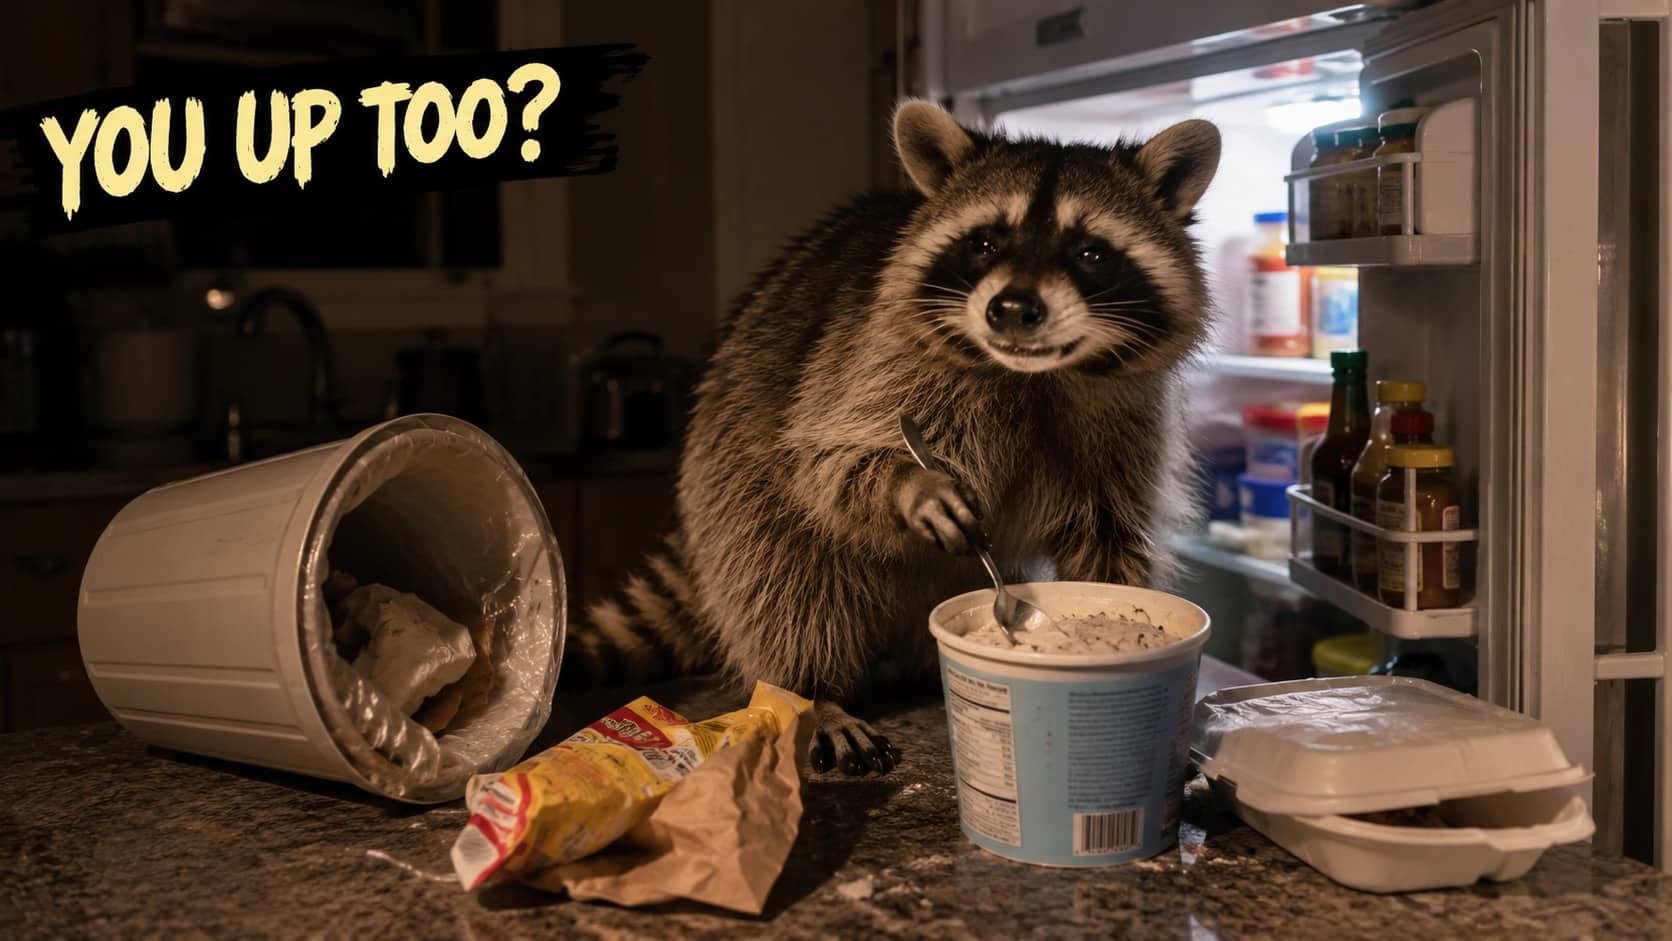
The older you get, the more your actual celebration goals shift entirely toward getting a solid eight hours of sleep.
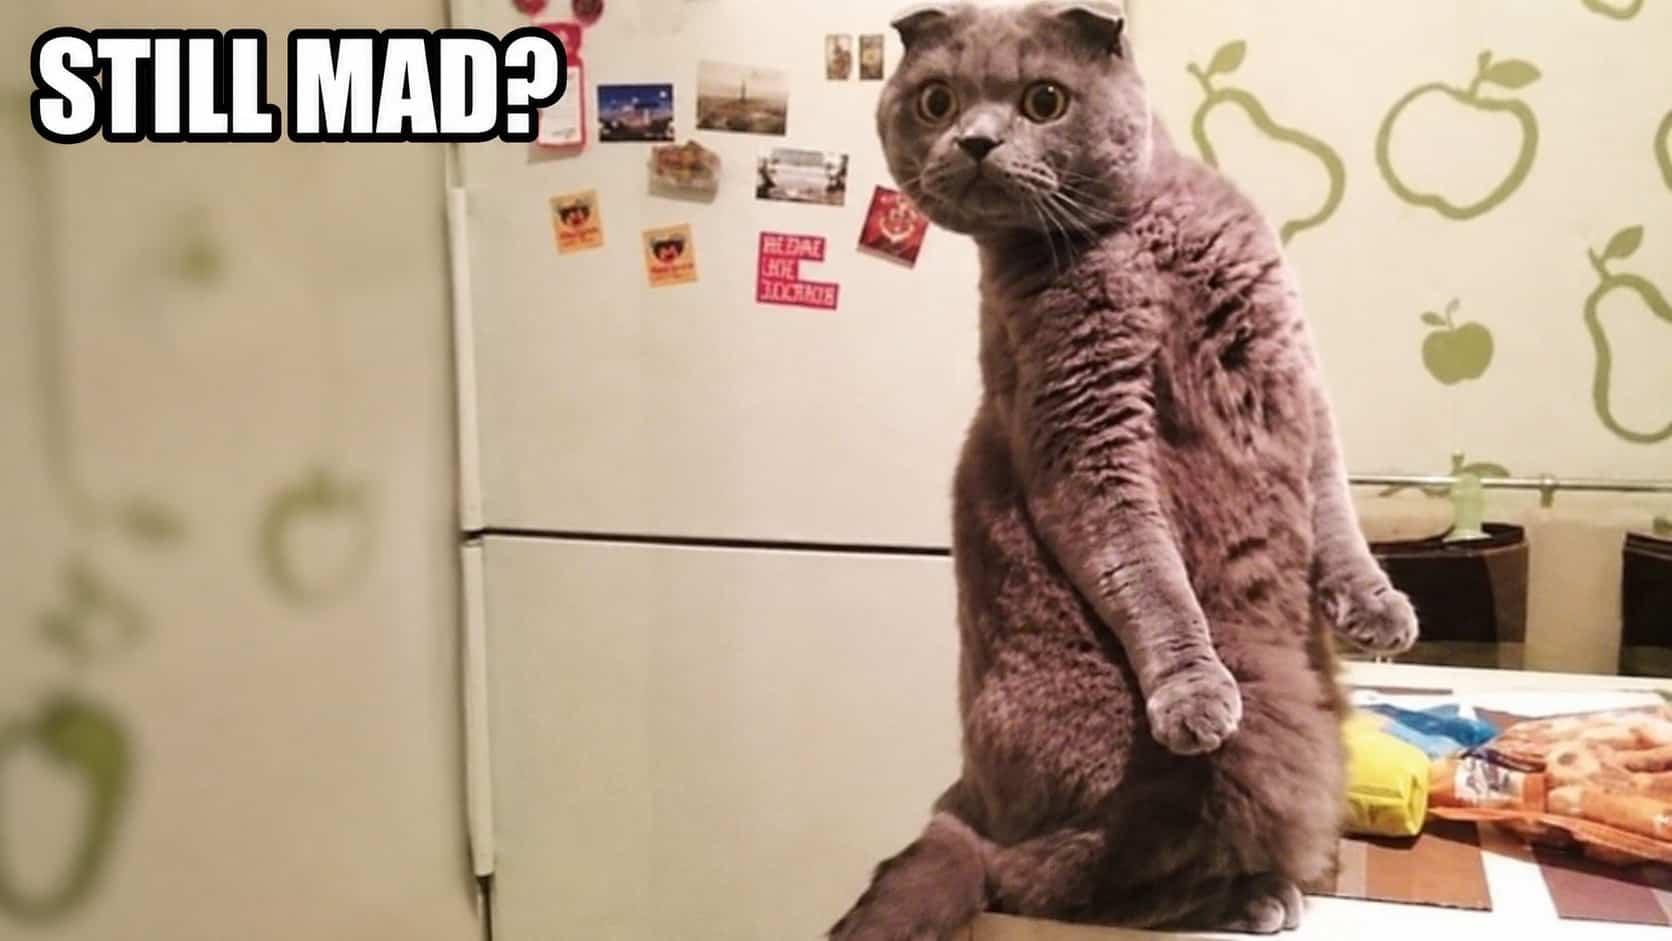
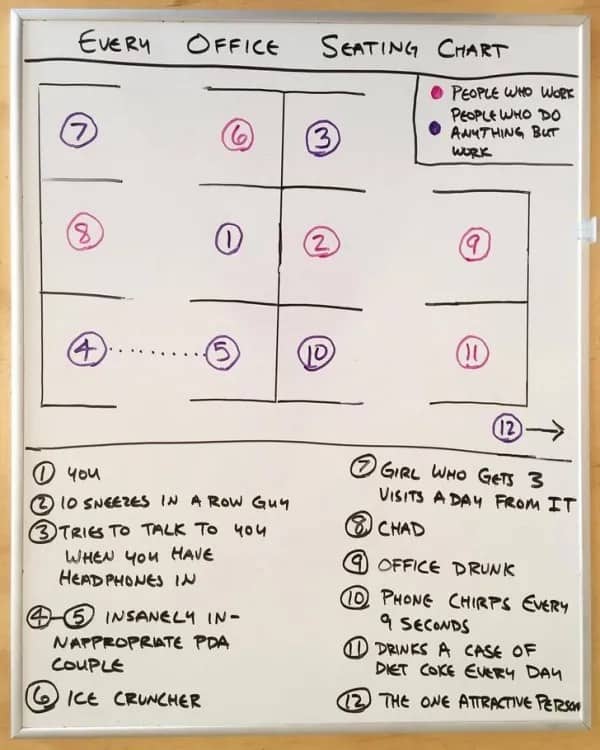
The text tone on my smartphone is the single greatest threat to my peace of mind.
Creative charts
Read More
Look, the actual reason Matt Surelee’s work hits as hard as it does is that he has, somehow, figured out how to render the small unspoken anxieties of contemporary adulthood into the visual language of a high school math class, and the rendering produces a kind of immediate recognition that prose alone could never quite manage. The funny graph memes circulating online are essentially the documented evidence of this exact translation, where a feeling that you had been carrying privately gets converted into a visual format that turns out to be, somehow, more relatable than the feeling itself.
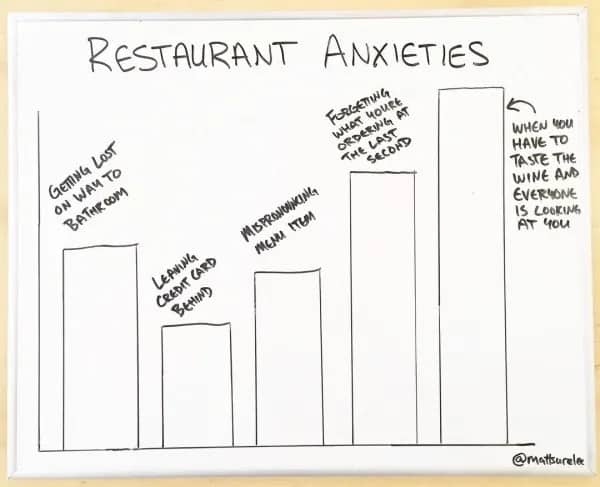
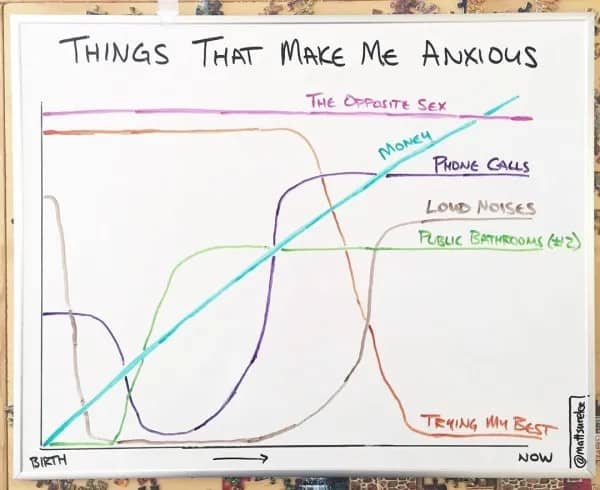
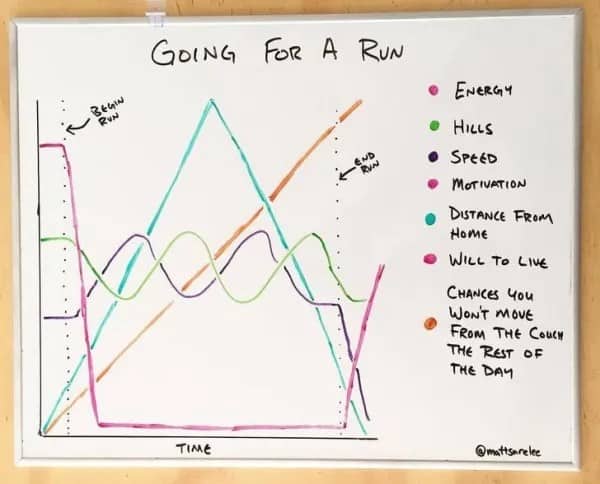
The aging content specifically is where this gets genuinely uncomfortable. There is a particular flavor of chart that involves tracking, over time, the specific ways in which adult life has quietly diminished your tolerance for stimulation, social interaction, and the act of consuming anything other than water after 7 p.m. The hilarious chart memes in this lane are not, mostly, exaggerating. They are, statistically, accurate, and the accuracy is what makes the audience laugh and immediately text the chart to three different friends within four minutes of seeing it.
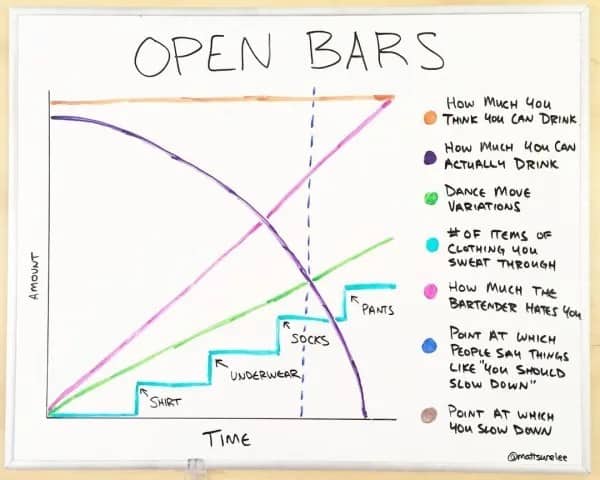
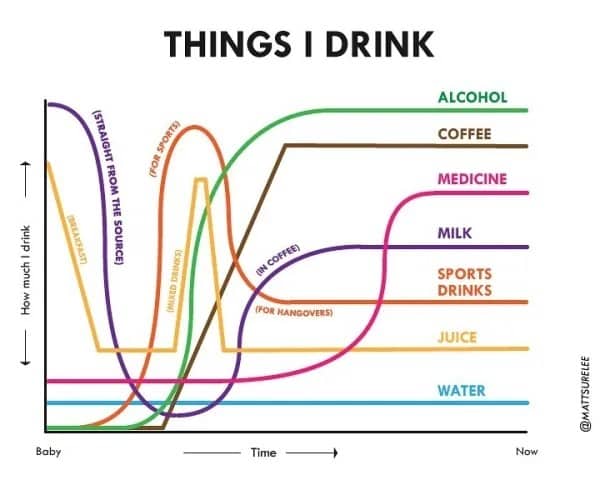
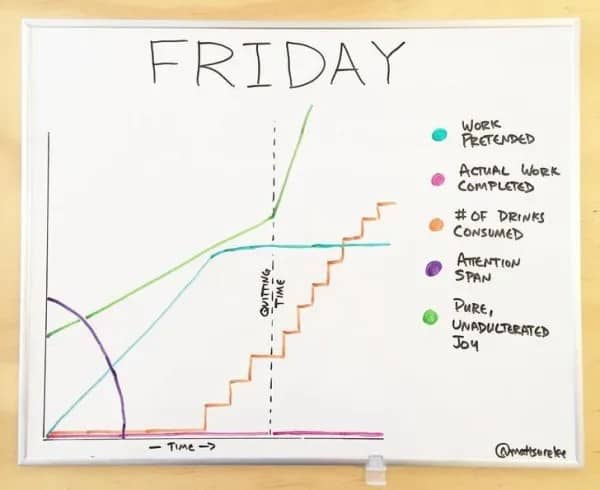
The substance content has its own particular flavor of self-recognition. The edible timeline. The open bar progression. The shifting volumes of various beverages from infancy to adulthood. The relatable graph memes in this category are essentially documenting a generational relationship to consumption that nobody is, mostly, willing to discuss seriously, and the visual format gives the audience permission to laugh at something that would otherwise feel uncomfortably close to a personal diagnosis.
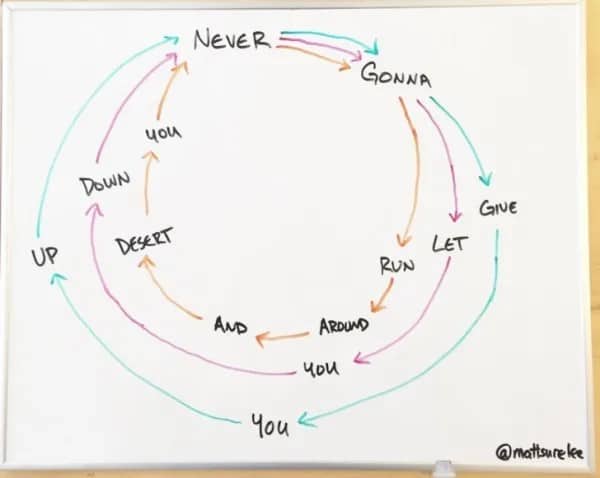
The bigger thing happening across all this charting work is that an entire generation has, over time, started to recognize itself in the small graphs and diagrams that the internet has produced as substitute for actual self-examination, and the recognition has produced one of the most quietly therapeutic content lanes currently in operation. The creative charts that travel the furthest are essentially the documented evidence that everybody is, mostly, carrying the same low-level anxieties, and the carrying is, somehow, more bearable when somebody else has converted it into a graph.
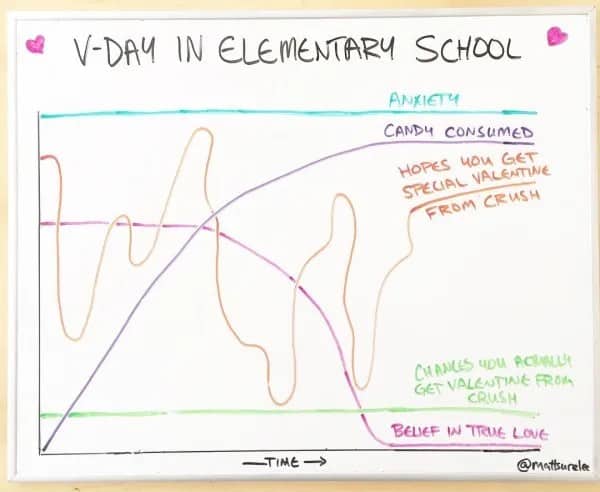
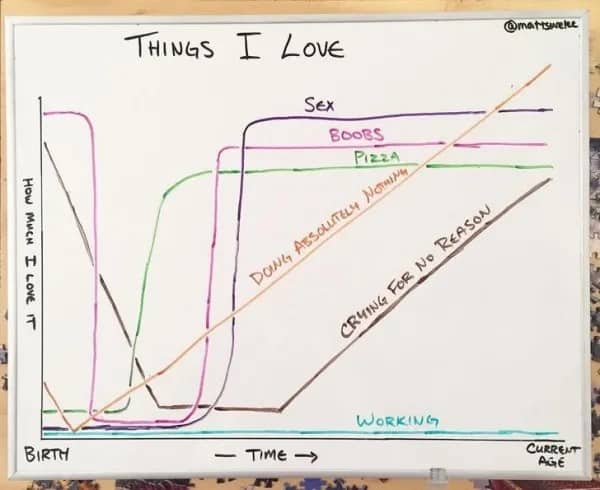
The funny chart content that endures is the kind that names something specific that the audience has been silently experiencing alone. The birthday decline. The roommate fatigue. The slow erosion of motivation that started, statistically, around age six. The graph is the medicine. The medicine works. The working is, against every academic expectation, what keeps the audience showing up for the next post.
The chart is hand-drawn. The data is uncomfortably accurate. The internet has, finally, found a way to do group therapy with a dry erase marker.
If the hand-drawn diagnostics were your kind of fun, our relatable humor content is right where you’d want to land next, and we’ve got plenty of millennial anxiety archives, adulting graph threads, and modern existential humor compilations for anyone whose self-awareness is currently being delivered through PowerPoint substitutes. Pick up a marker.
Read Memes
Get Paid

Laura Bennett has spent eight years immersed in internet culture, specializing in deep dives into meme origins, evolving meme trends, and digital subcultures. As a contributor for several prominent online platforms, including BuzzFeed’s meme division and Know Your Meme, she’s written extensively about viral moments from Crying Jordan to Woman Yelling at a Cat. Laura believes memes aren't just internet jokes—they're modern-day folklore. She brings that passion to Thunder Dungeon by keeping readers connected to what's culturally significant, hilarious, and timelessly viral.