These Interesting Infographics Made Me Feel Briefly Competent

Jun 07, 2026 08:00 AM EDT
A master collection documenting a high-utility interesting infographics visual series, front-loading a technical blueprint of residential plumbing infrastructure tracing sloped P-trap drain lines, a circular household utility database detailing clever mechanical life hacks for WD-40 spray lubricant, and a consumer validation matrix tracking US state codes stamped onto dairy processing milk jugs.
google discoverFollow us on Google Discover

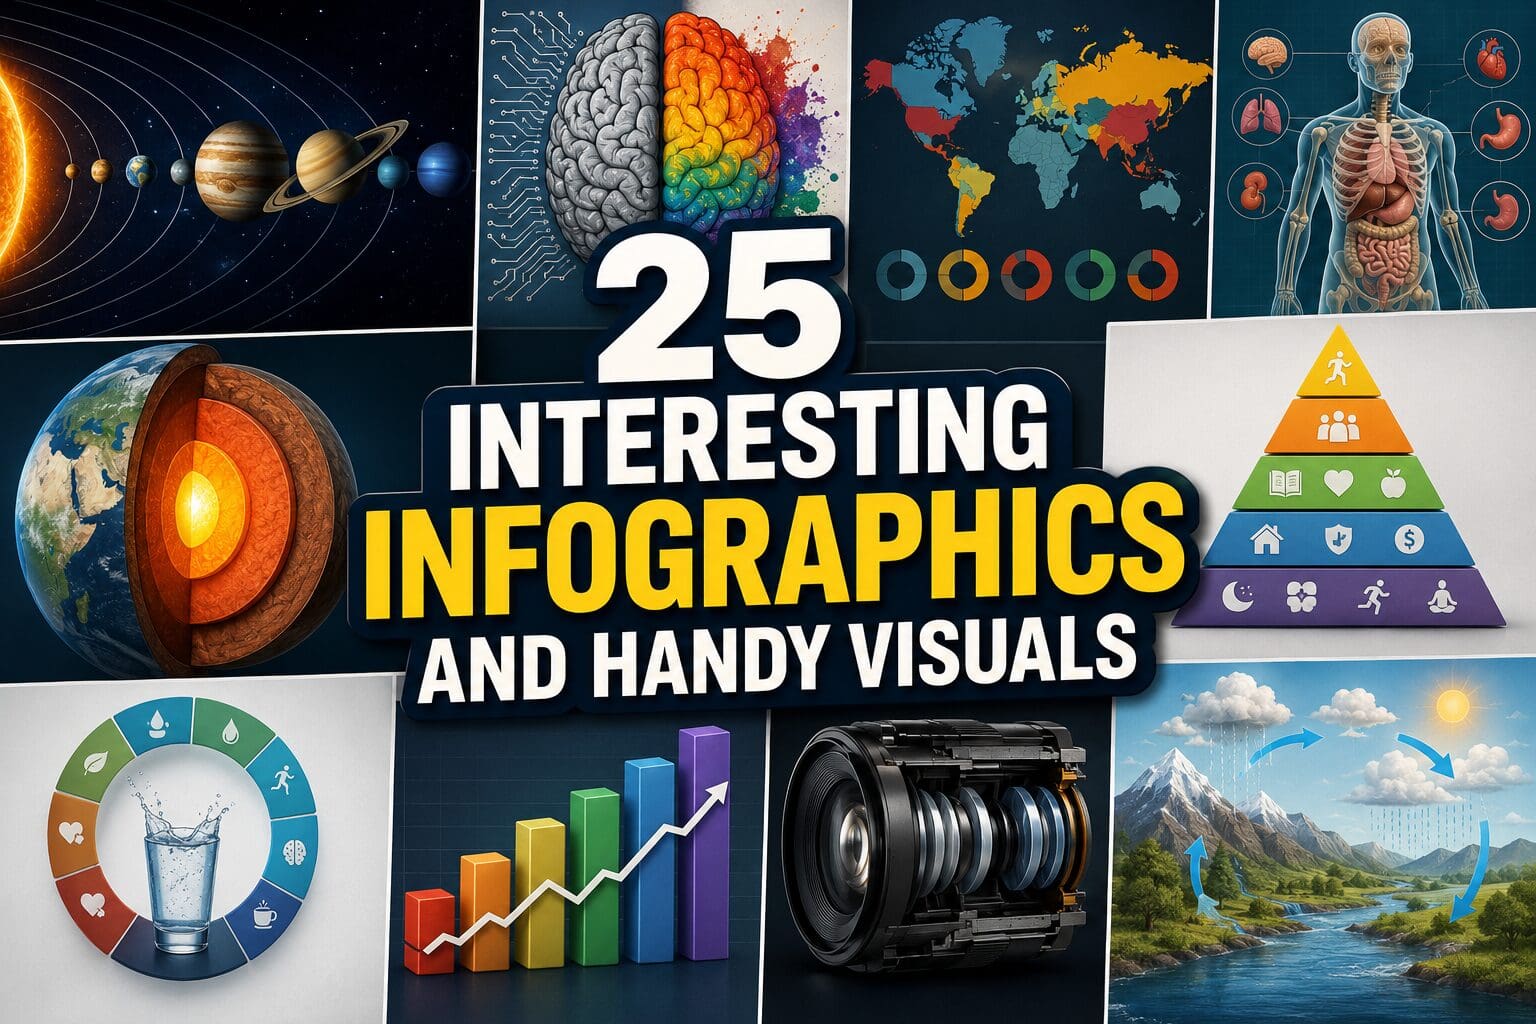
These interesting infographics are for the part of me that loves feeling mysteriously capable—like I could fix a sink, pick the right tool, and also choose the correct outfit palette, all before lunch. I don’t even need to use the information. I just need to look at it and feel smarter. If you’re into data visualization, helpful charts, and life hacks that scratch the “order in the chaos” itch, this gallery is your snack.

consumer awareness chart styled as an interesting infographic detailing the hidden meanings behind bottle cap colors on commercial water bottles, tracking classifications like flavor-added green caps, all-natural blue caps, alkaline black caps, filtered white caps, and electrolyte-enhanced red caps.

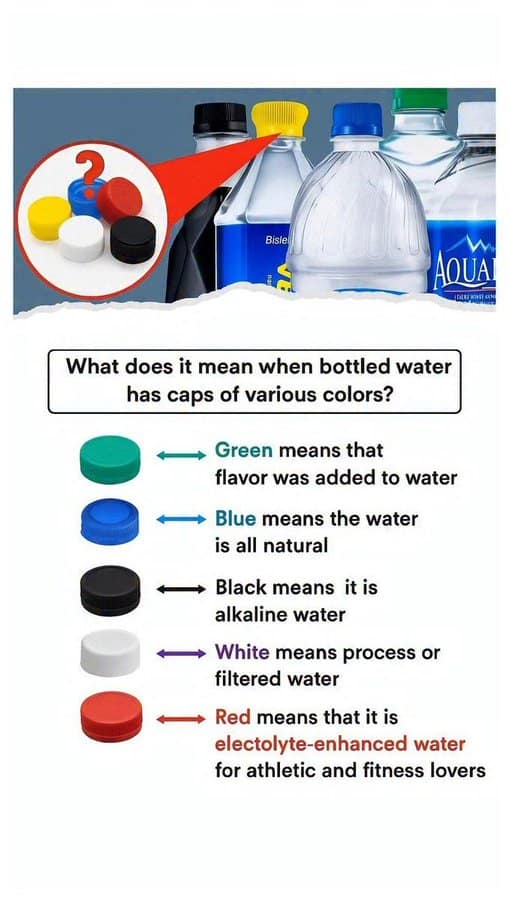
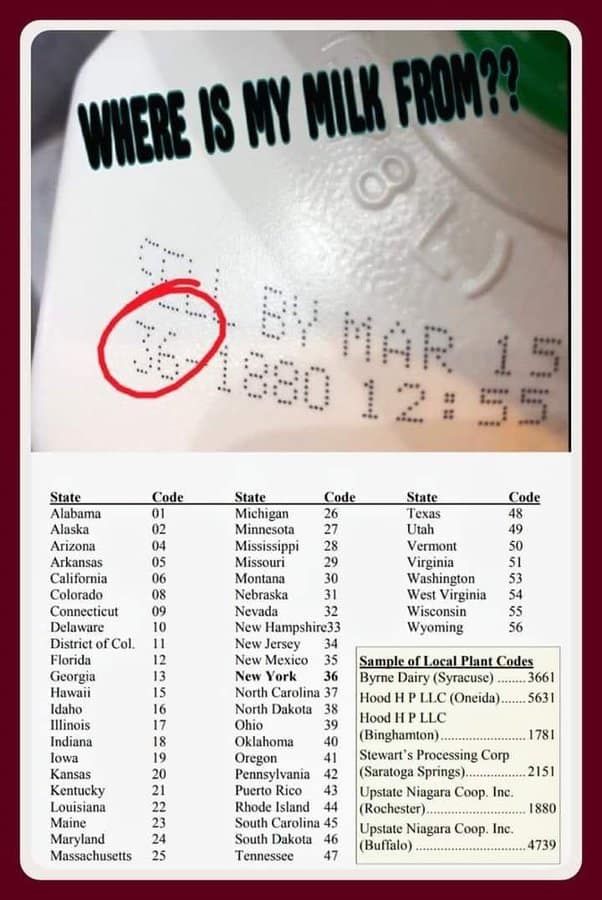
Finally, a handy field guide to help you determine if your premium hydration fluid was harvested from a pristine arctic glacier or compressed straight from the municipal tap.

home improvement guide structured as an interesting infographic titled "11 SMART WD-40 HACKS," breaking down practical auto and household uses for the spray lubricant including removing stickers, shining steel, fixing stuck zippers, untangling jewelry chains, and separating stuck Lego bricks.

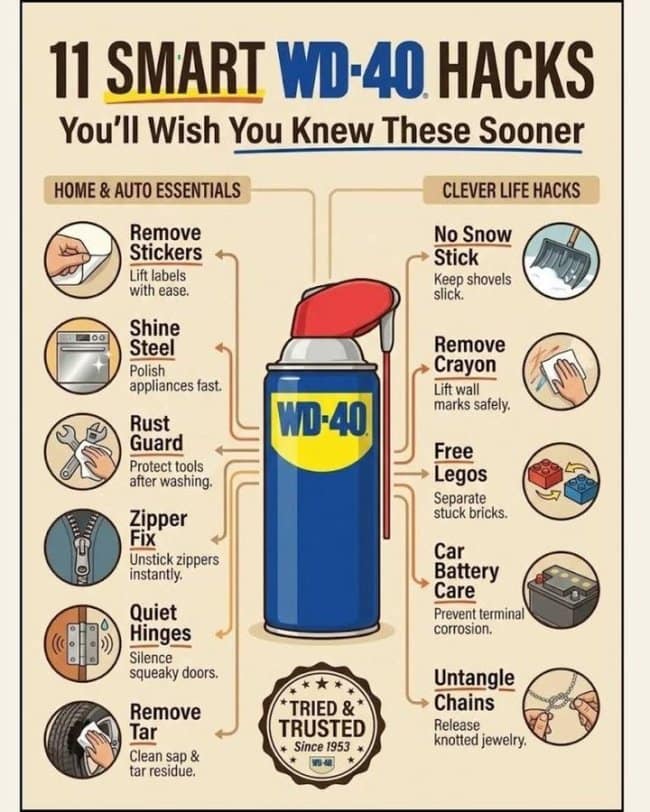
The sacred text for any homeowner who firmly believes that every single mechanical friction problem in human history can be conquered with a generous burst of blue-and-yellow aerosol spray.

A technical installation diagram working as an interesting infographic titled "VERY IMPORTANT TO KNOW," specifying recommended standardized installation heights for electrical wall outlets across living rooms, kitchens, tables, and emergency lights, containing a notable measurement typo labeling 1.10 meters as "1.10 cm".

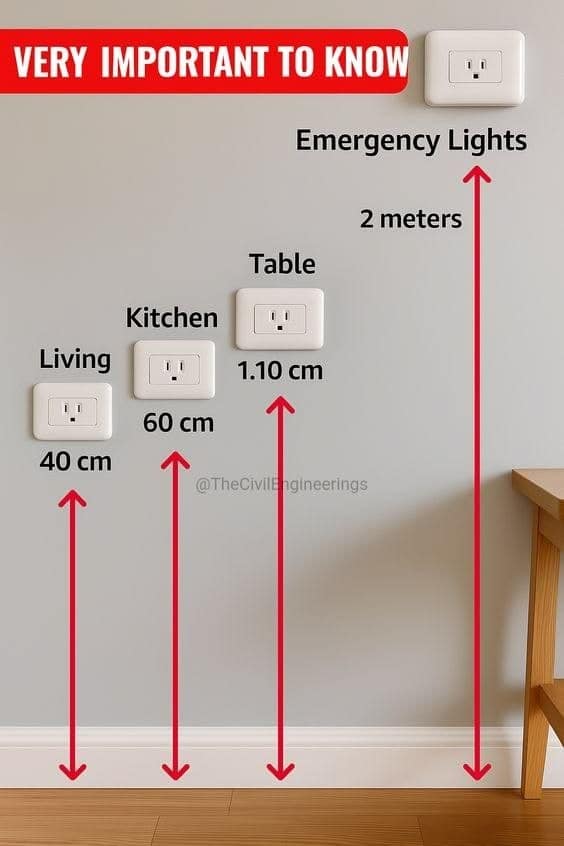
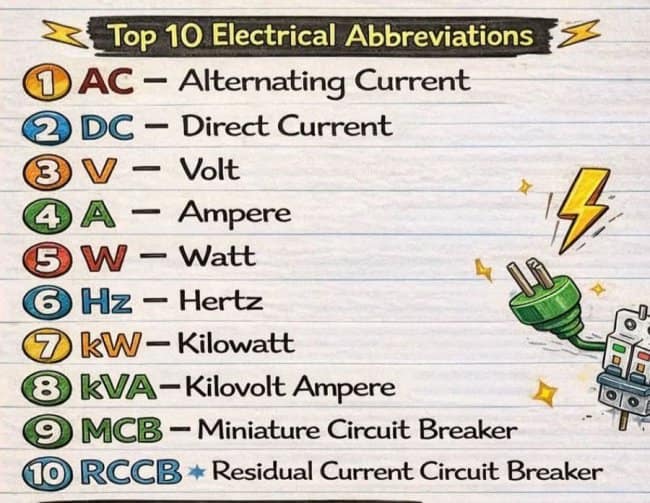
Looking forward to mounting my kitchen table outlets exactly 11 millimeters off the baseboards as explicitly commanded by this infallible civil engineering blueprint.

A mechanical reference guide formatted as an interesting infographic titled "Bolt & Spanner Size Chart," mapping out correct tool matches by pairing metric thread bolt sizes directly across from their corresponding open-ended spanner wrench sizes, running from 5mm up to 18mm.
An electrical engineering chart serving as an interesting infographic displaying standard household copper wire gauge cross-sections in square millimeters alongside matching residential hardware components like lighting fixtures, power sockets, air conditioners, and main building service panels.
A transparent plumbing blueprint working as an interesting infographic titled "ANATOMY OF DRAINAGE," tracing subterranean wastewater lines from residential toilets, showers, and sinks down through P-traps, vent pipes, Y-connectors, and sloped main drain pipes.

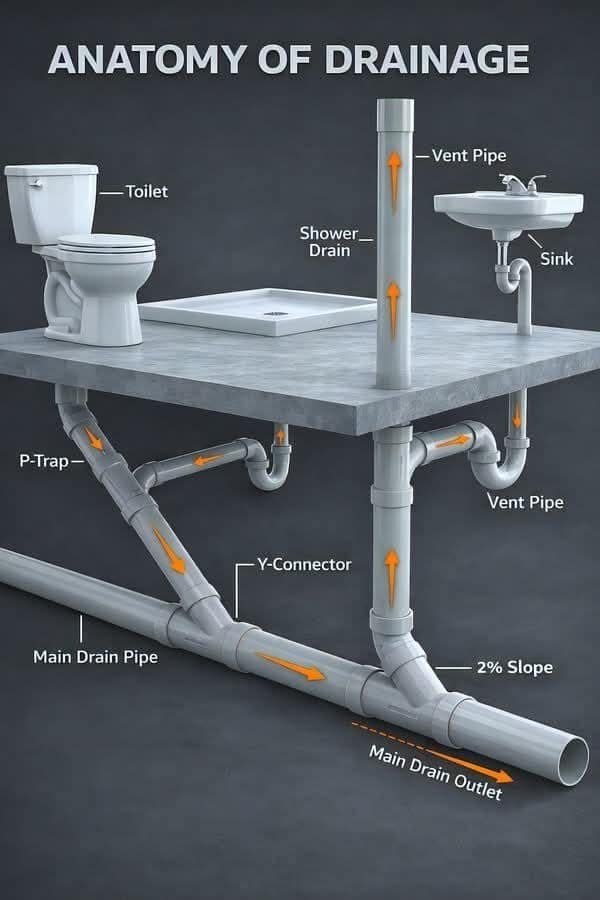
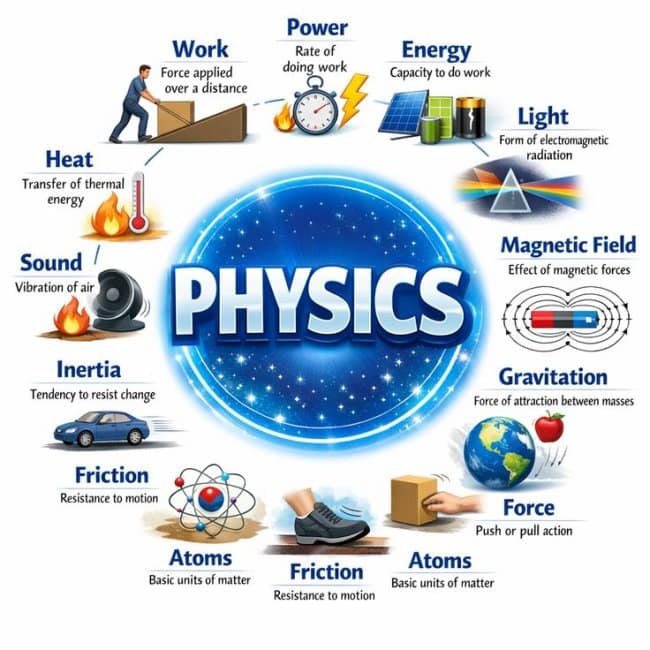
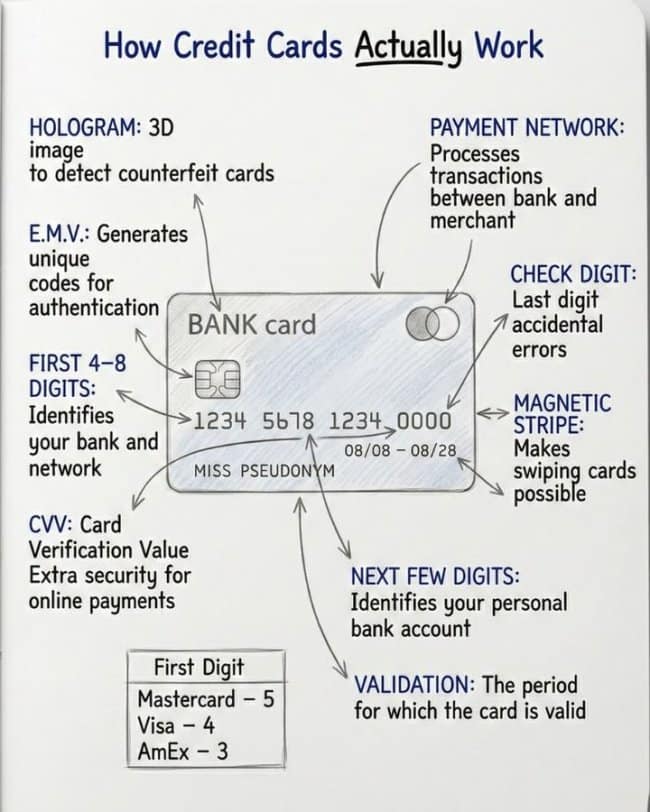
An exquisite x-ray view showing exactly how much complicated, multi-tiered physics it takes just to safely erase your morning disposal mistakes from the household ecosystem.

A detailed hardware reference sheet presented as an interesting infographic titled "Screw Types," mapping out rows of illustrated fasteners to identify head patterns and drive recesses like flat head, phillips head, torx plus, square recess, carriage bolts, and masonry screws.
A reference study sheet organized as an interesting infographic listing the "Top 10 Electrical Abbreviations," laying out clear, colorful badge definitions for common industry terms including AC, DC, Volt, Ampere, Watt, Hertz, and circuit breakers.
A mechanical layout overview structured as an interesting infographic titled "4 TYPES OF ELEVATORS," contrasting architectural profiles, shaft dimensions, and machinery room placements between compact residential hydraulic lifts and high-speed traction lifts.

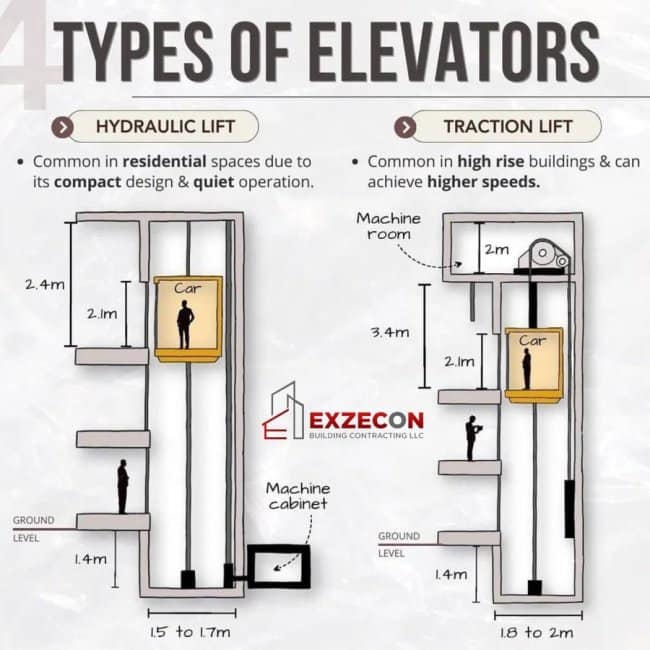
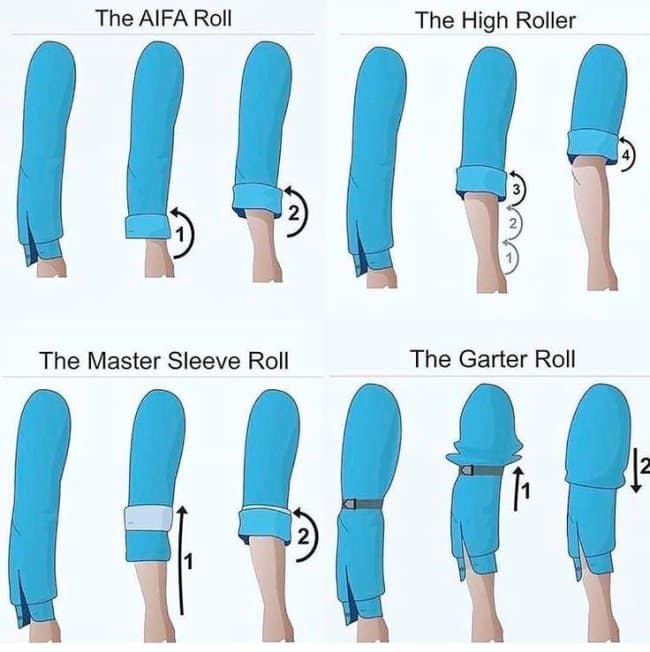
Prominently titled "4 Types of Elevators" despite only containing two distinct examples, because the graphic designers evidently got tired halfway through and took the stairs instead.

A scientific educational wheel operating as an interesting infographic centered on "PHYSICS," diagramming foundational concepts like heat transfer, kinetic work, power rates, magnetic fields, gravitation forces, inertia, and atomic structures, with several duplicate labels.
A sartorial instructional guide structured as an interesting infographic demonstrates step-by-step methods for rolling up dress shirt sleeves, charting four distinct techniques titled "The AIFA Roll", "The High Roller", "The Master Sleeve Roll", and "The Garter Roll" over illustrated arms.
A comprehensive men's wardrobe reference layout acting as an interesting infographic titled "SUMMER STYLE - Men's Outfit - COLOUR COMBINATION PALETTE," detailing ten minimalist capsule color combinations alongside fabric types, seasonal footwear options, and standard accessories.

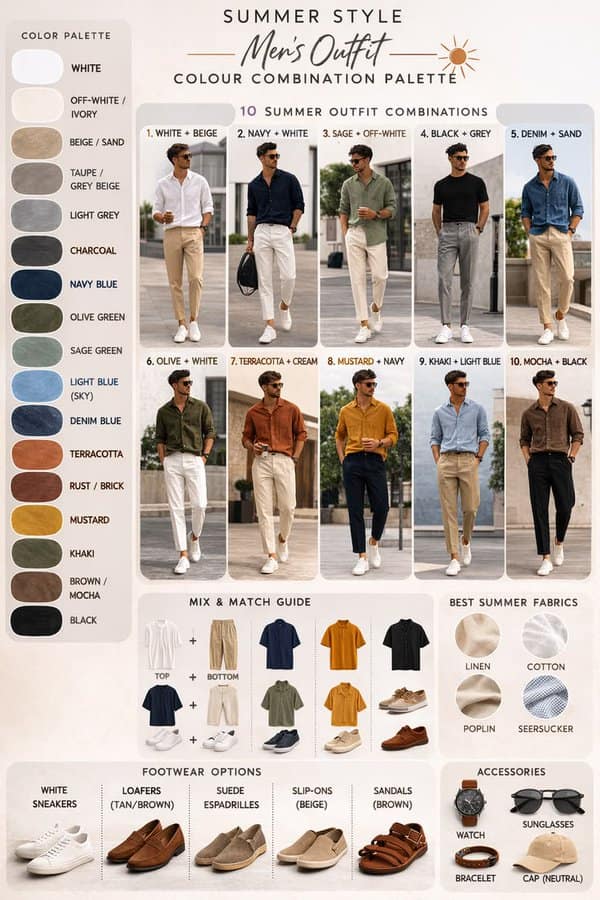
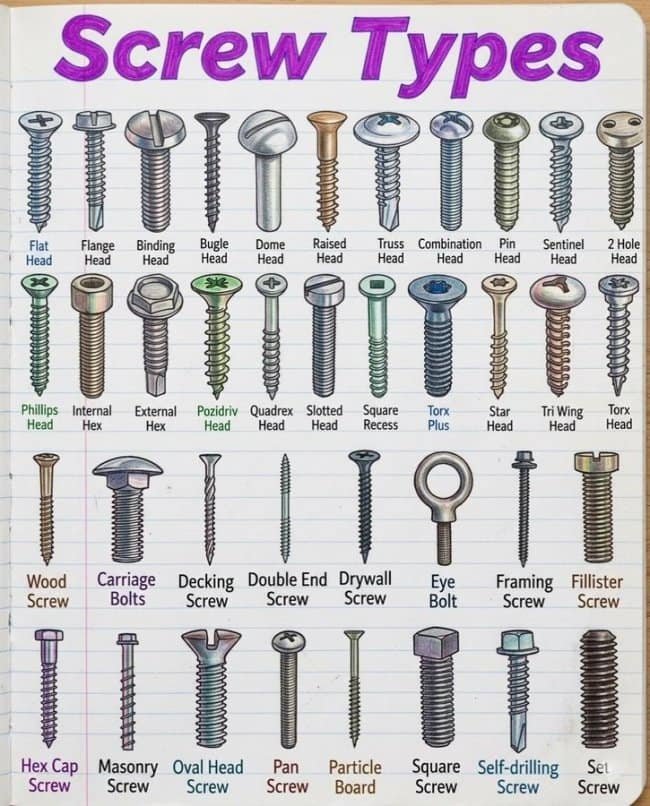
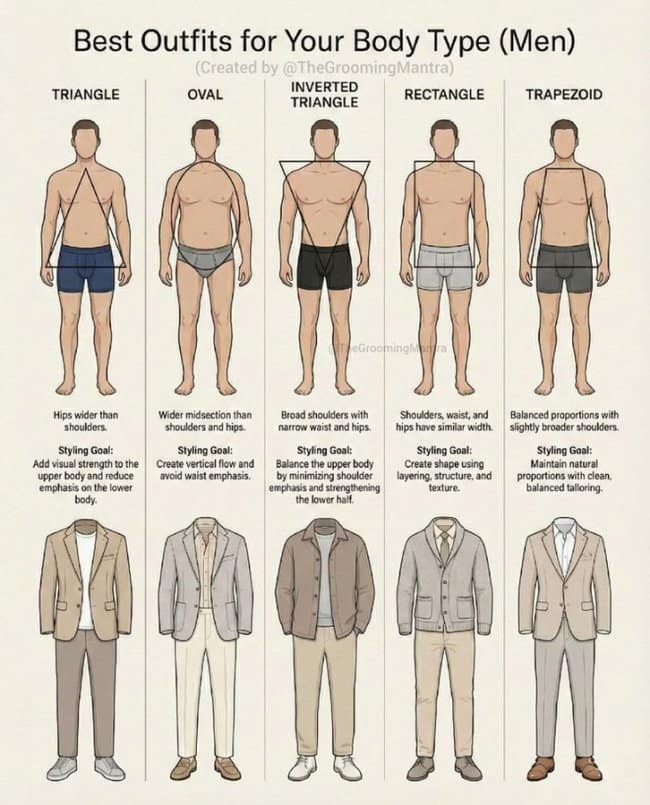
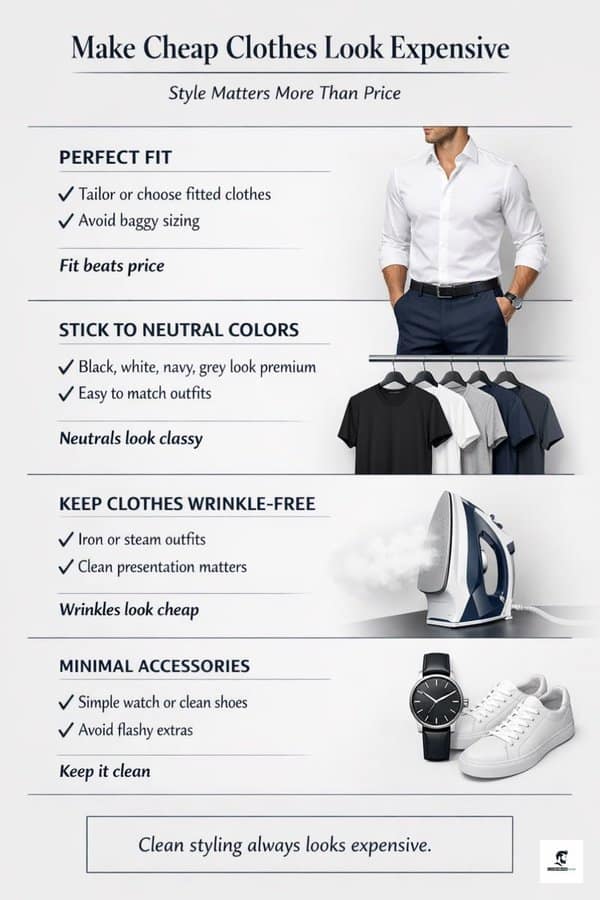
A highly structured structural layout designed to help men confidently choose between looking like a pristine coastal resort influencer or a high-end luxury minimalist.

A male fashion anatomy sheet organized as an interesting infographic titled "Best Outfits for Your Body Type (Men)," categorizing five baseline male shapes—Triangle, Oval, Inverted Triangle, Rectangle, and Trapezoid—with explicit tailoring recommendations and suited styling goals.
A geometric grooming style guide working as an interesting infographic titled "SUNGLASSES FOR FACE SHAPES," pairing six distinct facial silhouettes—Oval, Square, Heart, Round, Diamond, and Oblong—with their optimal eyewear shapes like Wayfarers, Aviators, and D-Frames.

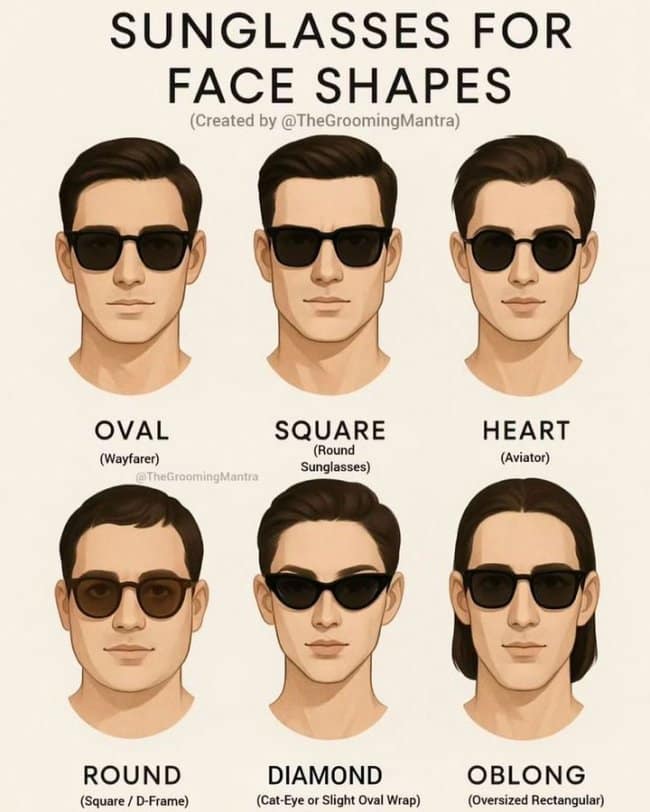
An essential protective map to ensure your choice of trendy summer eyewear makes you look like a sharp cinematic protagonist instead of an overzealous 1970s highway patrol operator.

A binary styling analysis arranged as an interesting infographic titled "Shoes That Instantly Elevate Your Outfit," contrasting a left-hand column of "Outfit-Killing Shoes" like dirty or overly flashy sneakers against a right-hand column of "Style-Boosting Shoes" featuring clean white trainers, classic loafers, and Chelsea boots.
A software conversion guide displayed as an interesting infographic splits a two-column whiteboard table into "PAID" applications on the left and their direct "FREE" open-source or competitor counterparts on the right, matching platforms like Netflix to Tubi, ChatGPT to DeepSeek, and Canva Pro to MS Designer.
A technical utility master list formatted as an interesting infographic titled "SECRET IPHONE CODES," charting multi-digit functional dial pad codes to execute diagnostic cellular commands, such as blocking outgoing caller ID profiles, displaying hardware IMEI serial numbers, or checking data balances.

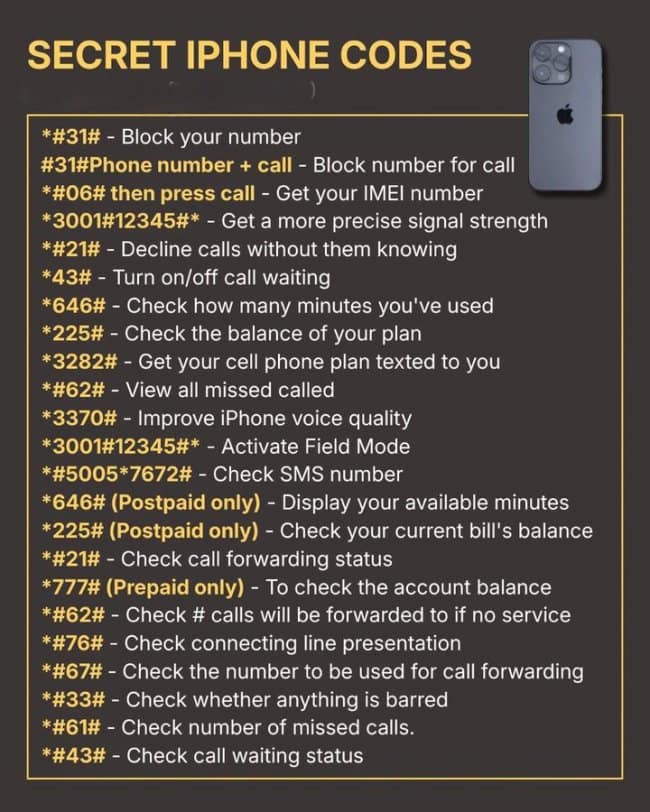
Punching an unhinged, 15-character string of hashes, asterisks, and numbers into your dial pad like a specialized terminal operator just to figure out why your cell reception instantly drops to zero bars whenever you sit down on the living room sofa.

A culinary transparency tracker operating as an interesting infographic titled "WHERE IS MY MILK FROM??," displaying a close-up product validation photo of a dairy carton stamp, paired with a reference database mapping numerical codes directly to US states and processing facilities.
financial hardware system layout drafted as an interesting infographic titled "How Credit Cards Actually Work," utilizing a notebook sketch approach to isolate and explain core credit card features including embedded EMV security chips, payment verification networks, CVV validation windows, and magnetic strips.

Today’s theme: everything has a system, apparently.

The satisfying thing about interesting infographics is how they take a confusing problem and flatten it into something your brain can hold. Suddenly, the world feels less random. There’s a chart for it. A code for it. A diagram that says, “Relax, this is knowable.” That’s why data visualization is so addictive—it turns vague stress into a checklist.

And I love the mix of practical and slightly absurd. One minute you’re in “helpful charts” mode, learning how things connect behind walls or why certain sizes match certain parts. Next minute you’re staring at a guide that confidently explains something while quietly containing a typo that could launch a small household disaster. It’s human. It’s hilarious. It’s why life hacks need a second opinion.

There’s also something comforting about seeing everyday life treated like a puzzle instead of a personal failing. Can’t figure out why your device is acting up? Here’s a code list. Not sure what you’re buying at the store? Here’s a label guide. Want to look more put-together without spending a fortune? Here’s a simple visual rule set. Interesting infographics don’t judge you—they just hand you a map.

If you want more brain-tickling content, follow this with 45 Funny Shower Thoughts That Made Me Pause, 31 Random Facts For Your Next Trivia Night, and 32 Relatable Memes About Random Life Things.

I’m Laura Bennett, and I love helpful charts because they make adulthood look like a solvable problem for five straight minutes.

Laura Bennett has spent eight years immersed in internet culture, specializing in deep dives into meme origins, evolving meme trends, and digital subcultures. As a contributor for several prominent online platforms, including BuzzFeed’s meme division and Know Your Meme, she’s written extensively about viral moments from Crying Jordan to Woman Yelling at a Cat. Laura believes memes aren't just internet jokes—they're modern-day folklore. She brings that passion to Thunder Dungeon by keeping readers connected to what's culturally significant, hilarious, and timelessly viral.
Read Memes
Get Paid

The only newsletter that pays you to read it.

A daily recap of the trending memes and every week one of our subscribers gets paid. It’s that easy and it could be you.