

Global comparison charts
Growing up, I was always curious about how life differed across the globe. What do people eat in Japan compared to Brazil? Who lives the longest, and which country tops the list for healthcare? As I dug deeper into these questions, I found that global comparison charts were the key to understanding these complex and fascinating topics. These charts provided a snapshot of how different countries stack up against each other in various aspects of life. Whether it's about healthcare quality, the most popular foods, or even the average salaries, these infographics tell a story that numbers alone can't convey.
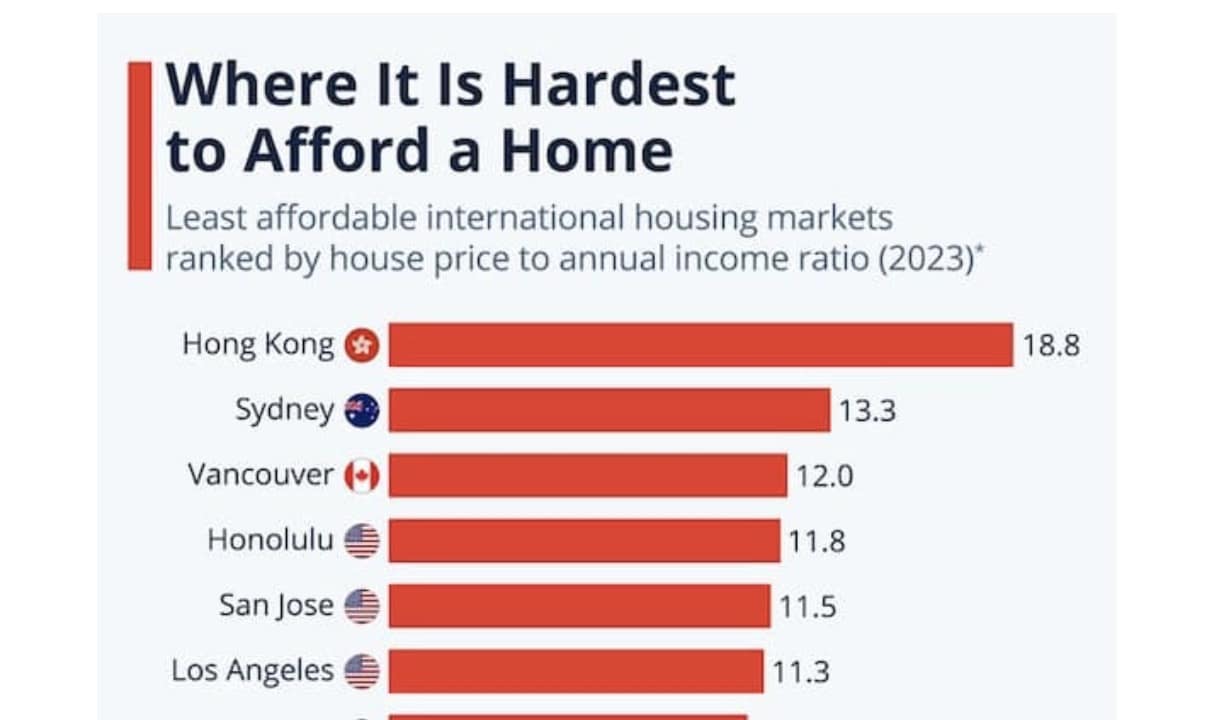
This collection of 35 global comparison charts offers a vivid glimpse into the diverse metrics that define our world. From the countries with the highest average salaries to those boasting the best healthcare, these infographics reveal the stark contrasts and surprising similarities across the globe. They explore various aspects like international statistics, world data infographics, and global rankings, making it easier to understand the intricate web of factors that shape our lives. Whether you're curious about which nations have the longest average lifespans or where your favorite foods originate, these charts have something to pique your interest. As you scroll through, you'll see just how interconnected—and yet so different—our world truly is.

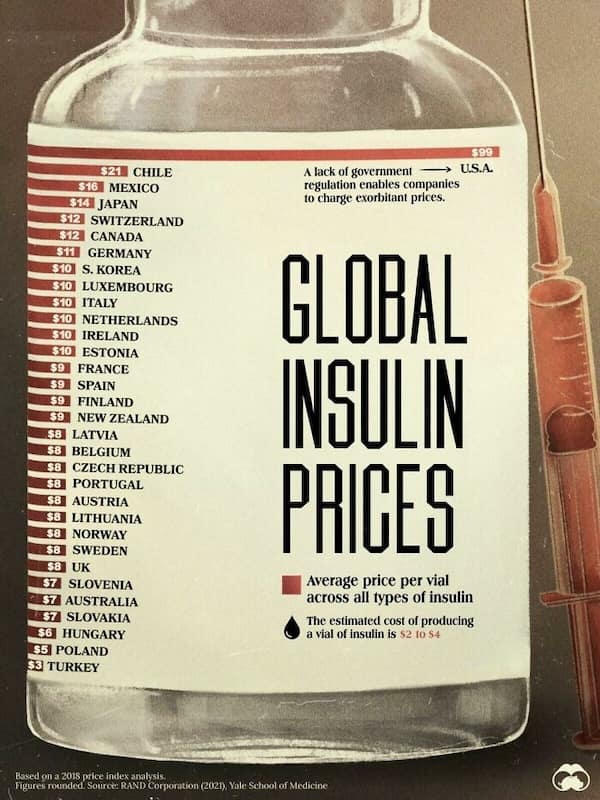
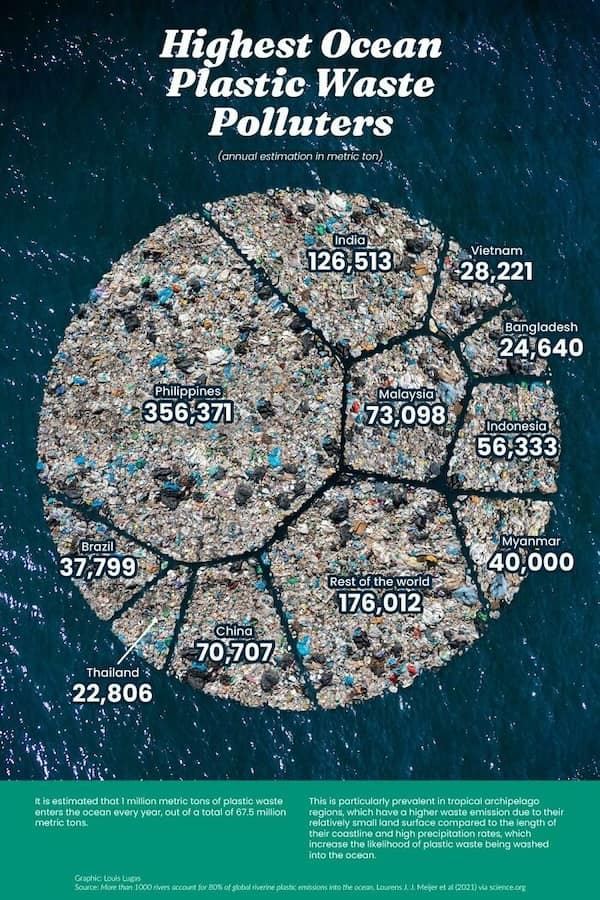
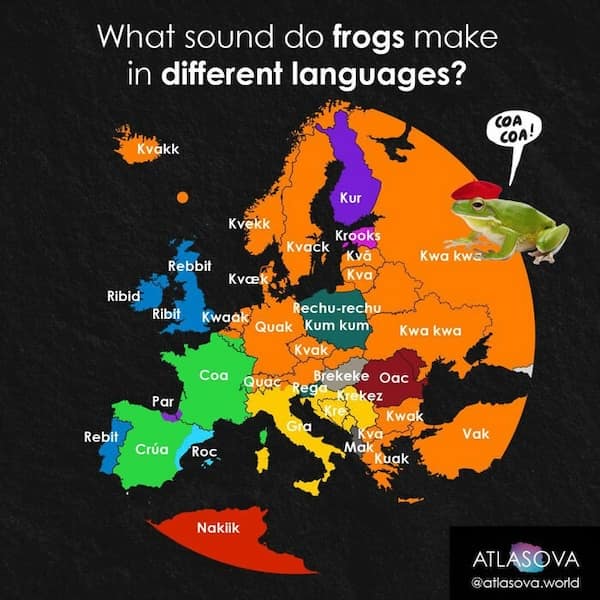


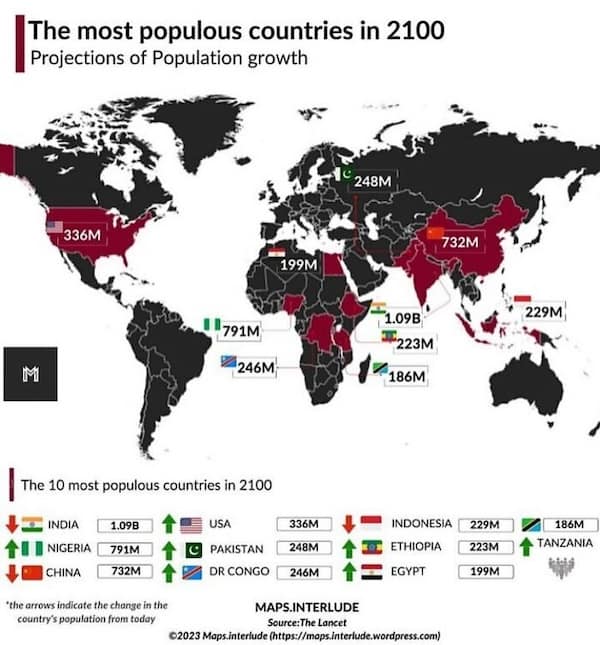

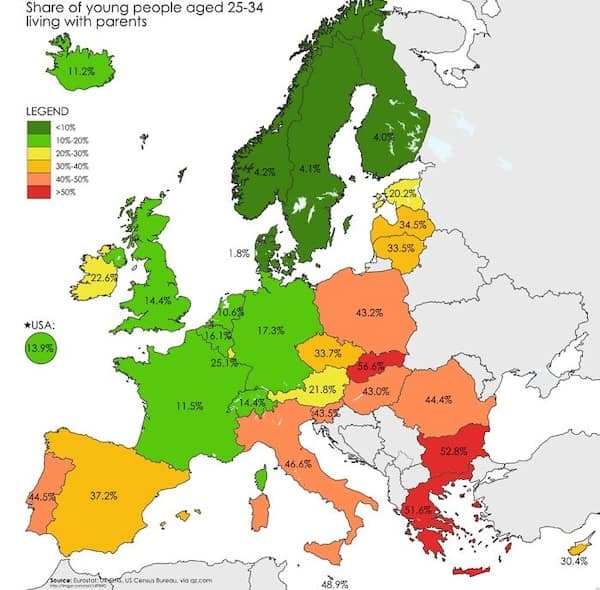


After delving into these 35 global comparison charts, you’ve gained a fresh perspective on how countries measure up against one another. You saw a range of topics covered, from healthcare systems to culinary favorites, and even the varying salaries around the globe. The photos and infographics offered a colorful and informative journey through international statistics, leaving you with a better understanding of the world we live in. The visual representation of global data made complex information more digestible, and perhaps even a bit more fun to explore.
If these global comparison charts sparked your interest, you’re in for a treat with more meme galleries on our site. Dive into collections that explore quirky international traditions, humorous cultural differences, and even more fascinating world data infographics. Whether you’re into learning about global rankings or just enjoy a good laugh at the oddities of international life, our themed meme galleries have plenty to offer. Take a journey through the lighter side of global statistics and continue exploring the world, one meme at a time.

Read Memes.
Get Paid.
The only newsletter that pays you to read it.
A daily meme recap, and every week one subscriber gets paid.
How it worksWho needs to see this?
Send it to the friend who’ll laugh the hardest, or post it for everyone.