36 Interesting Infographics, Maps, and Charts You’ll Stare at Too Long
Some facts hide in textbooks; others throw on neon jackets and dance across your screen. That’s the charm of interesting infographics—information dressed for a party and ready to mingle. We’ve wrangled thirty-six graphics that mash up maps, charts, and oddball diagrams to answer questions you didn’t know you had, like how coffee consumption lines up with time-zone grumpiness or why the world’s most common password is still “password.”
Each image is a mini adventure: equal parts art project and trivia night cheat sheet. Whether you’re the friend who screenshots census data “for fun” or someone who just likes pretty colors that teach you something, this gallery of interesting infographics will scratch the itch. Dim the lights on that spreadsheet, fire up full brightness, and prepare to feel smarter almost by accident.
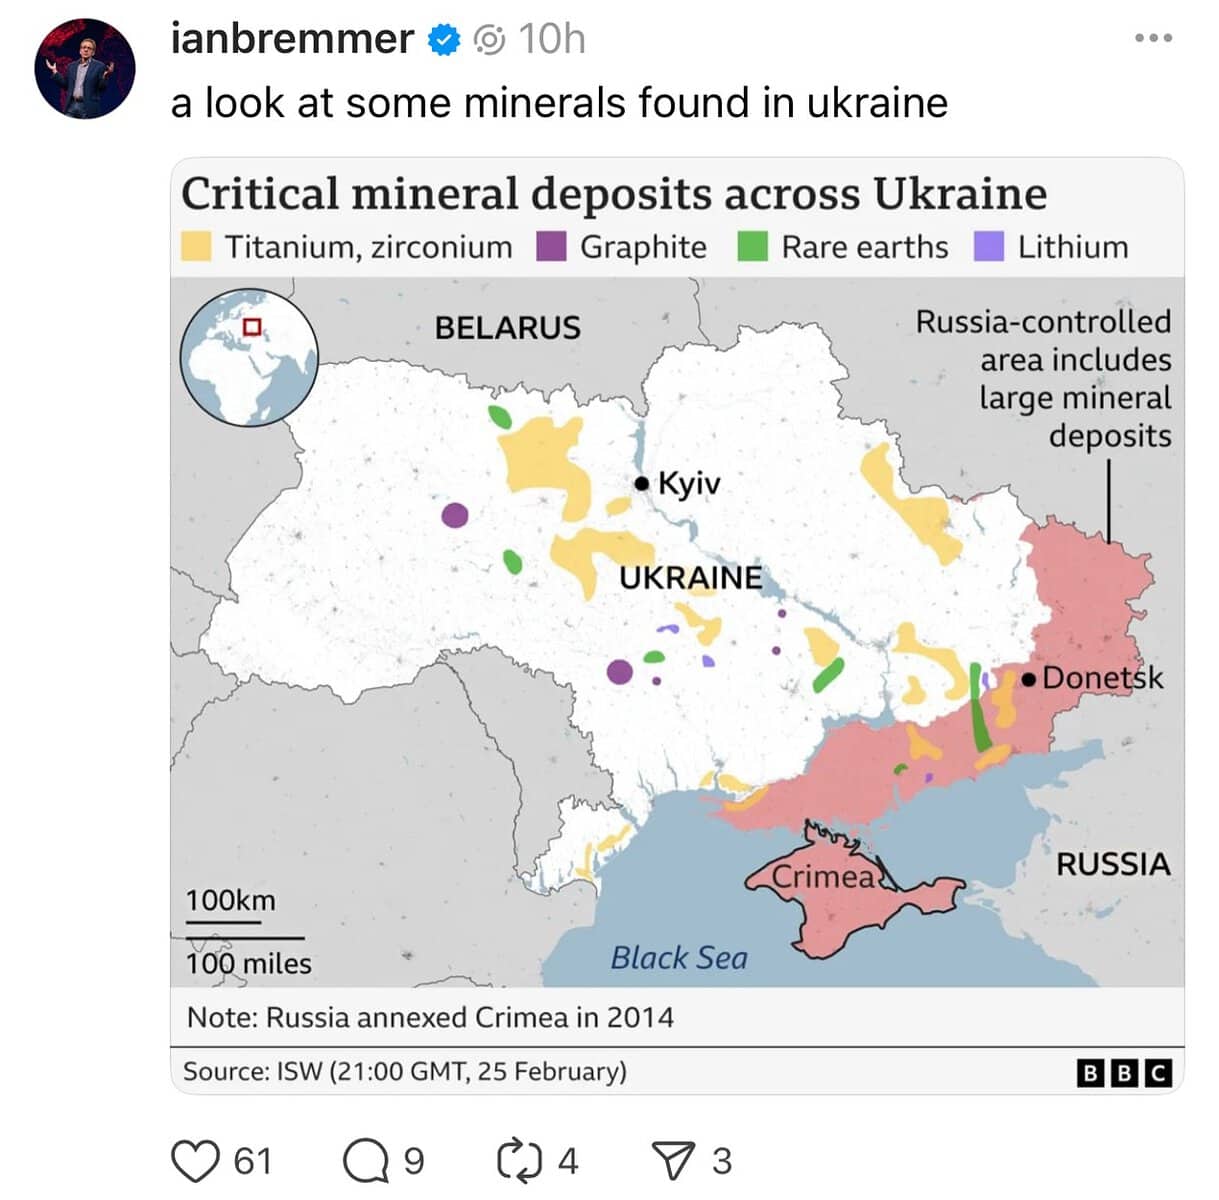
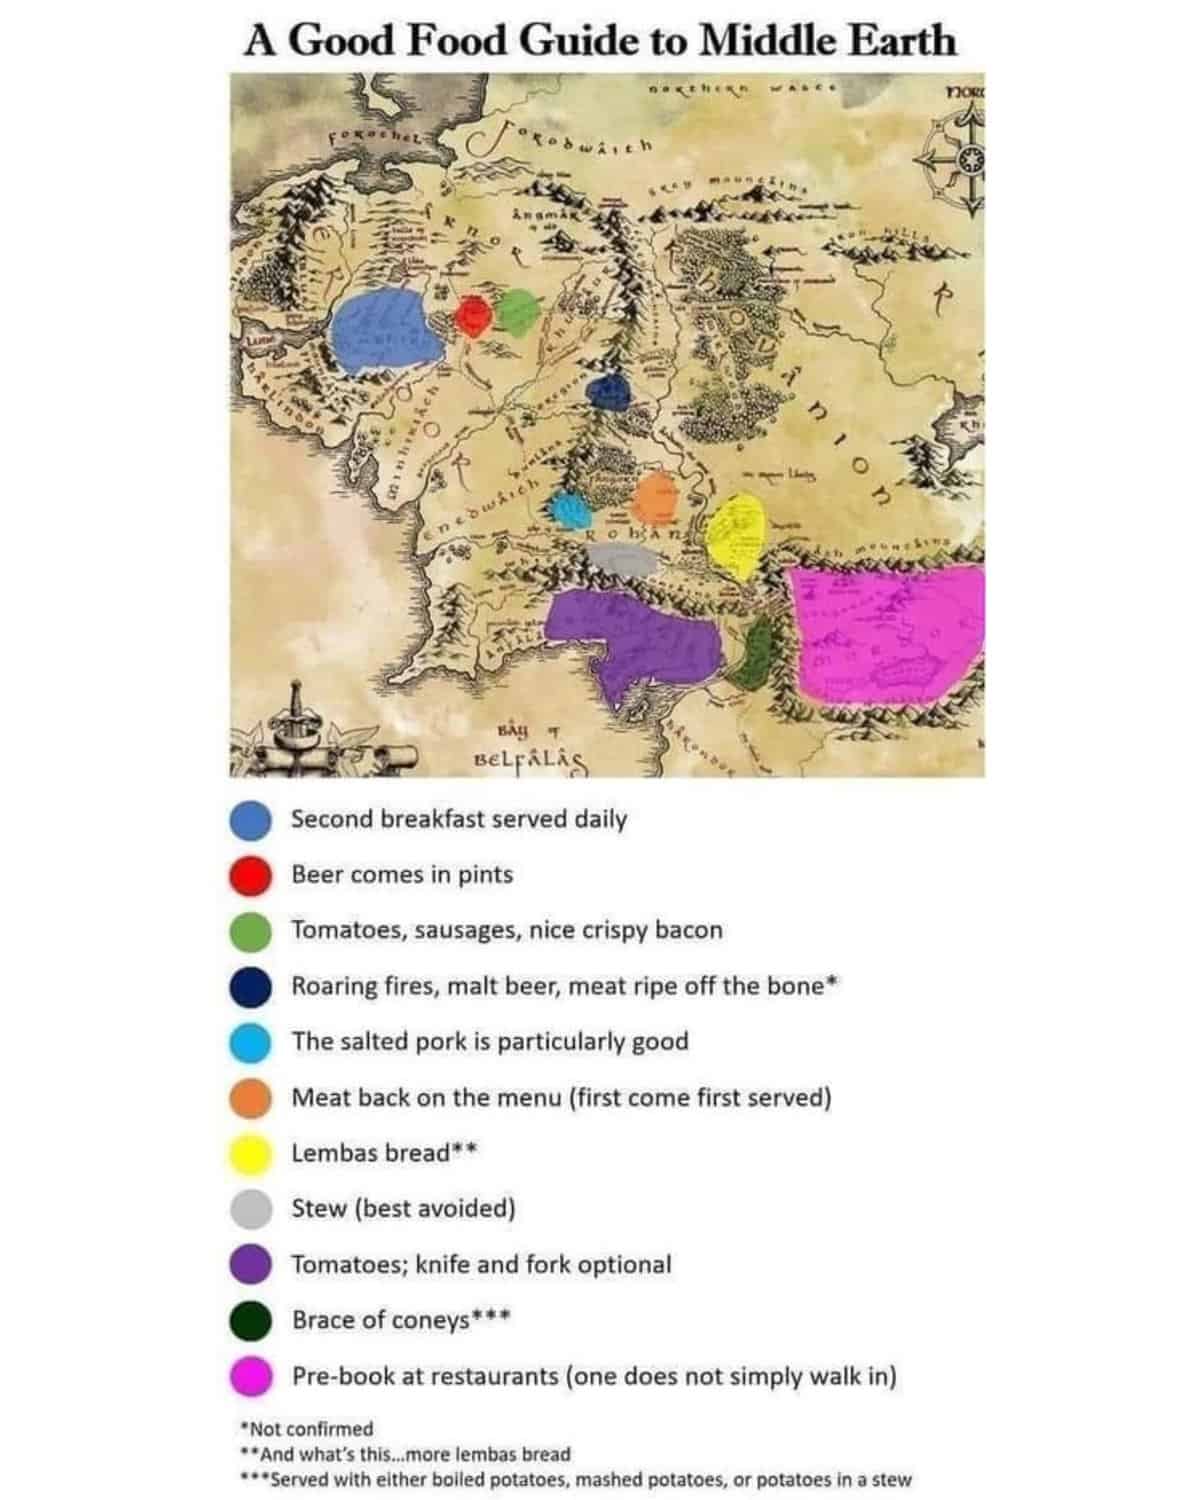
The scroll opens on visuals that make geography classes jealous—maps shaded in gradients revealing snack preferences by region, commute times plotted like storm radar, and migration patterns sketched as graceful flight paths rather than boring arrows. Next, chart humor nudges its way in: pie slices labelled “my free time” swallowed whole by “loading screens,” bar graphs tracking Wi-Fi rage alongside heartbeat spikes, and timelines charting fashion trends nobody admits following. You’re not asked to solve equations; the interesting infographics do the heavy lifting, delivering that sweet aha! without homework. By the final frame, the common theme crystallizes: data hits different when it looks good, tells a story quickly, and maybe pokes a little fun at human habits along the way.
Halfway through these interesting infographics, you caught yourself tilting the phone to examine tiny legends you swore you’d ignore. Curiosity officially caffeinated.
Next time a meeting slides into “circle back” purgatory, cue up this gallery of interesting infographics and let charts do the day-dreaming. Craving even more visual bite-sized wisdom? Thunder Dungeon shelves everything from historical memes to science & math memes about snack habits at 2 a.m. Remember: good infographics are like good jokes—stickier than Post-it notes and twice as likely to pop back into conversation.
Read Memes
Get Paid

Phil M., Co‑Founder & Content Strategist
Phil is one of Thunder Dungeon’s co‑founders, doubling as our resident meme analyst and dark‑room brainstormer. He specializes in trend‑spotting across social platforms and shapes the editorial calendar to keep our galleries fresh, topical, and worthy of your valuable procrastination.