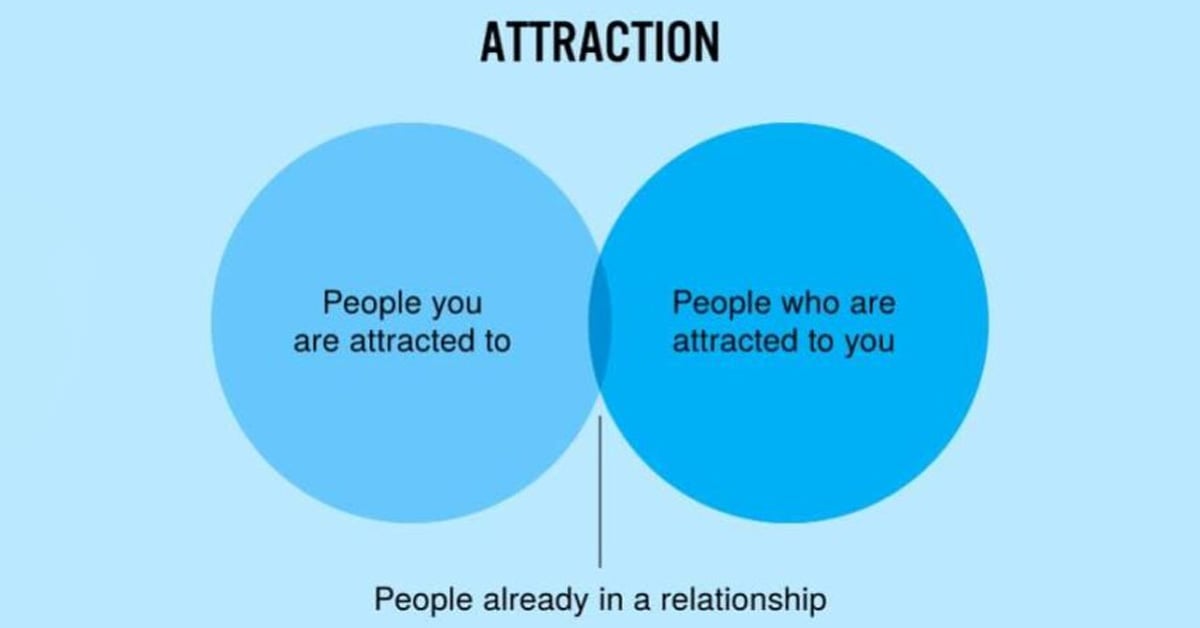
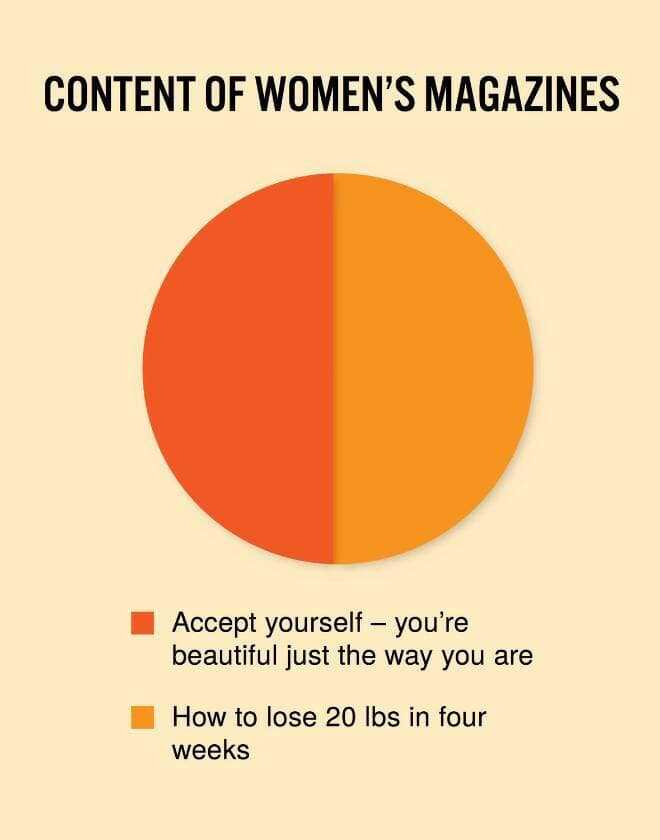
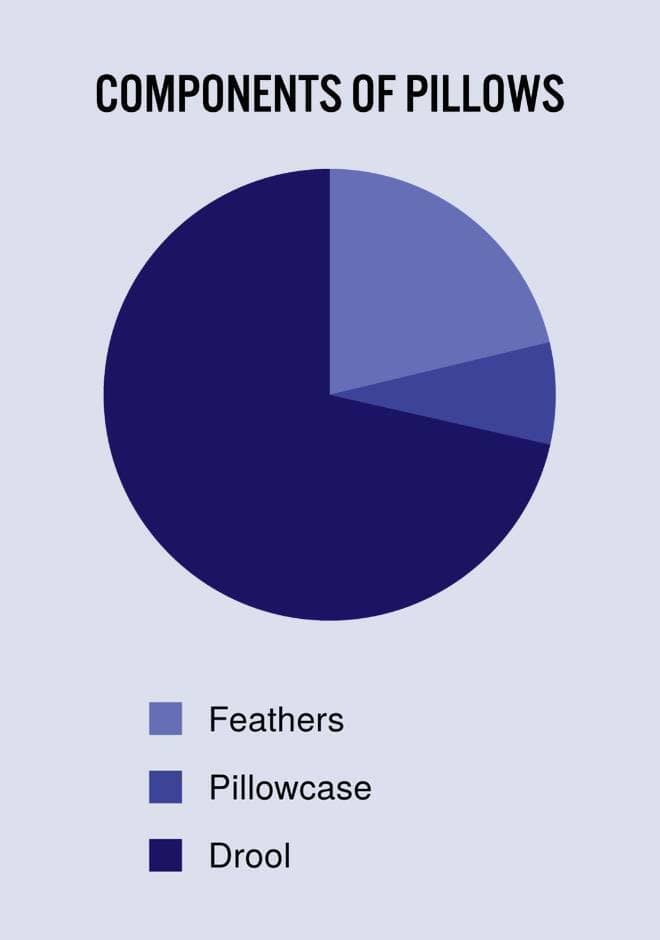
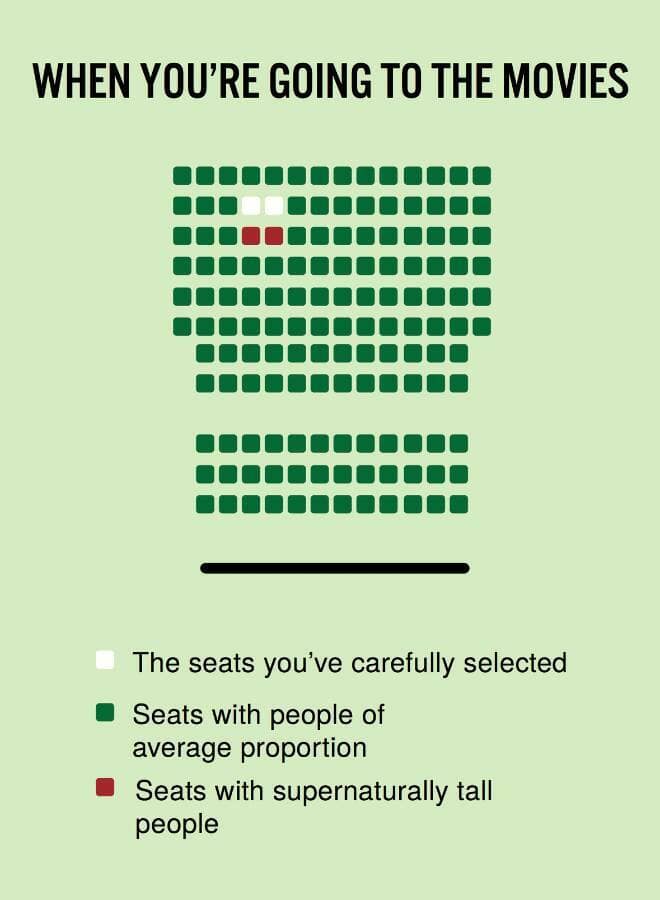
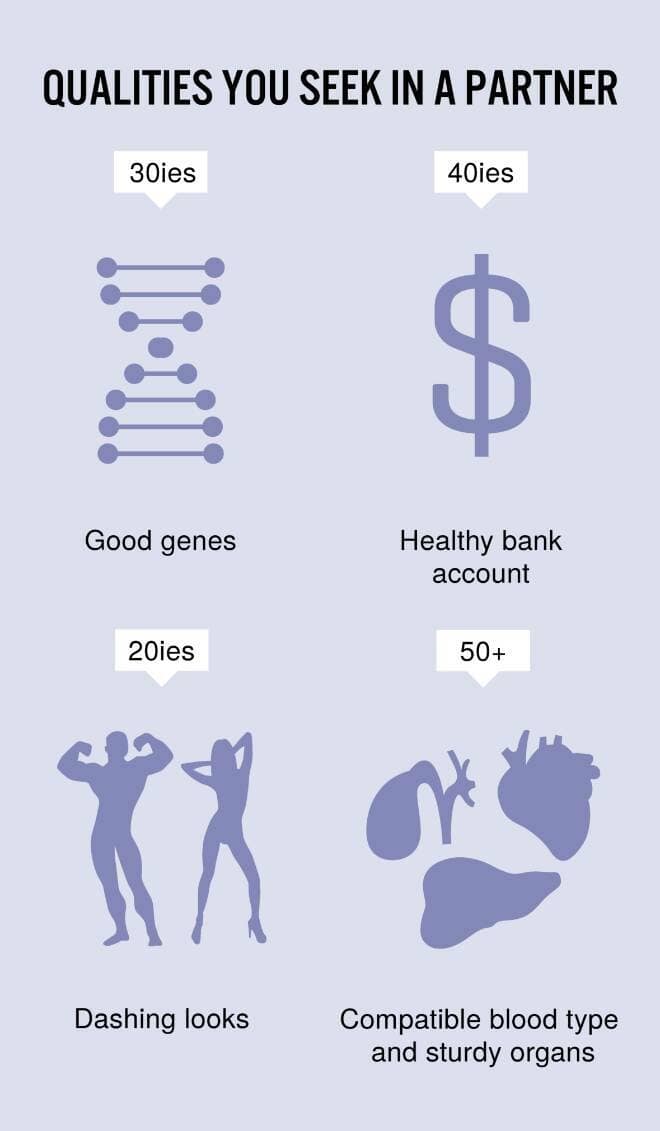
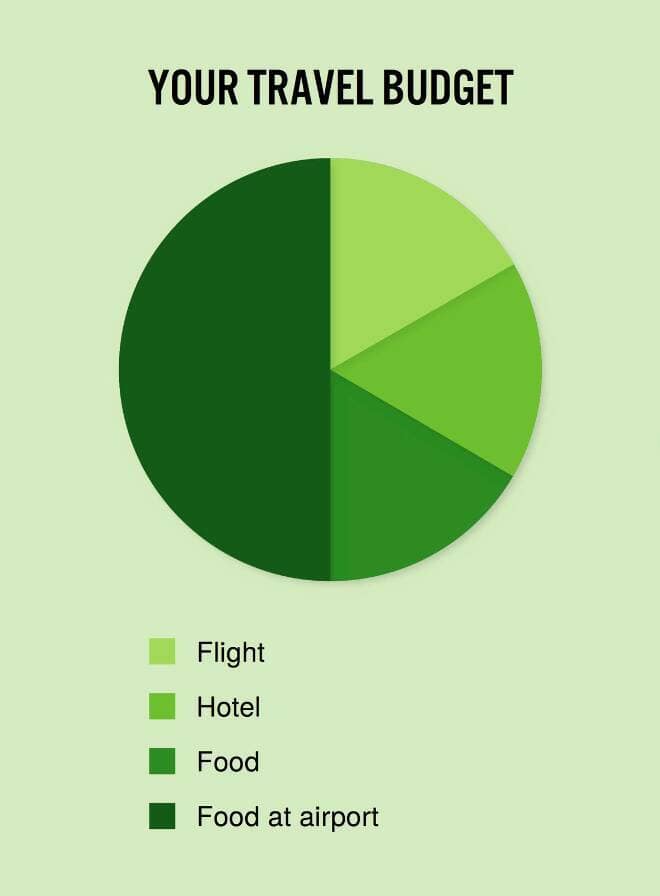
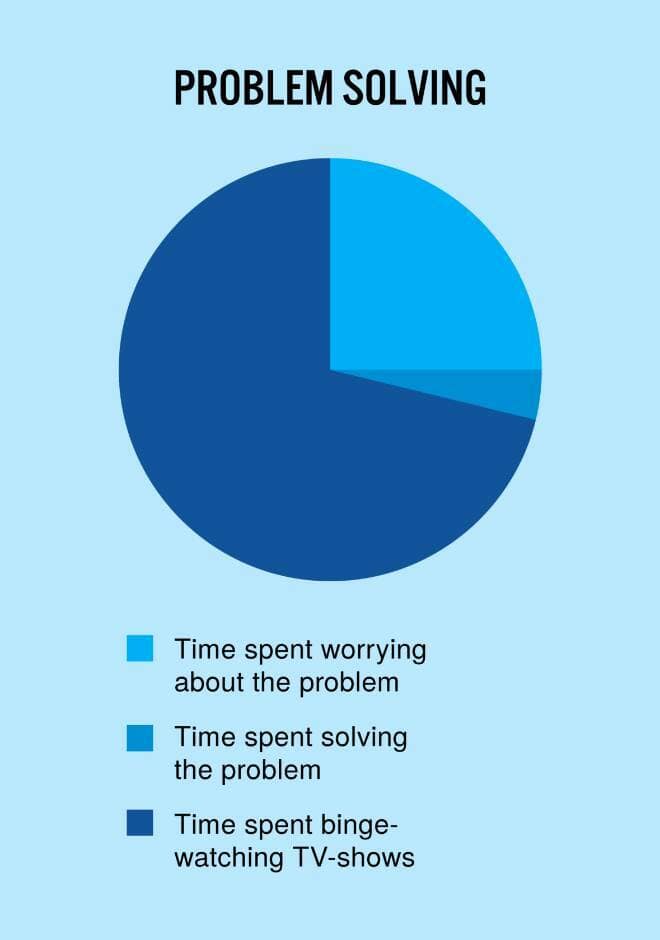
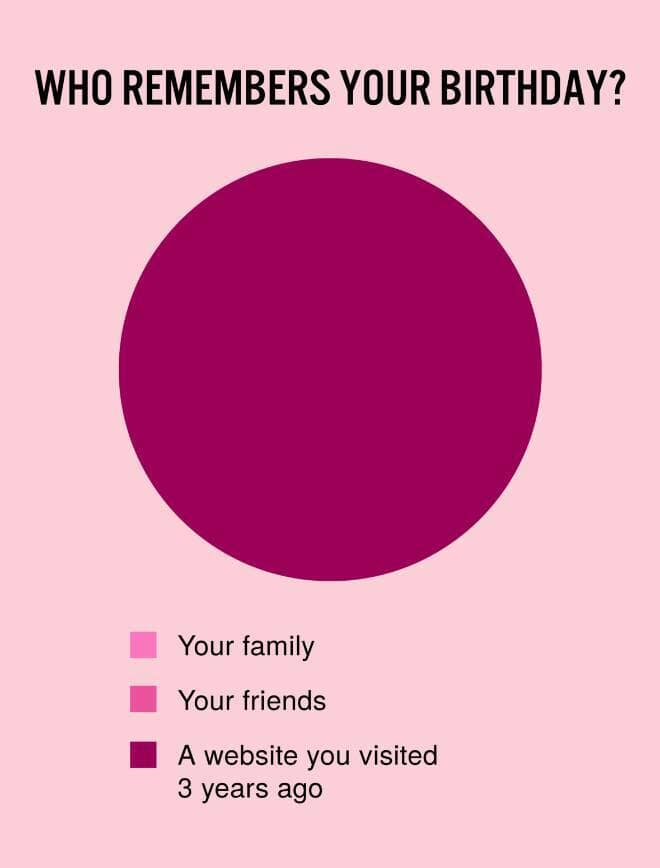
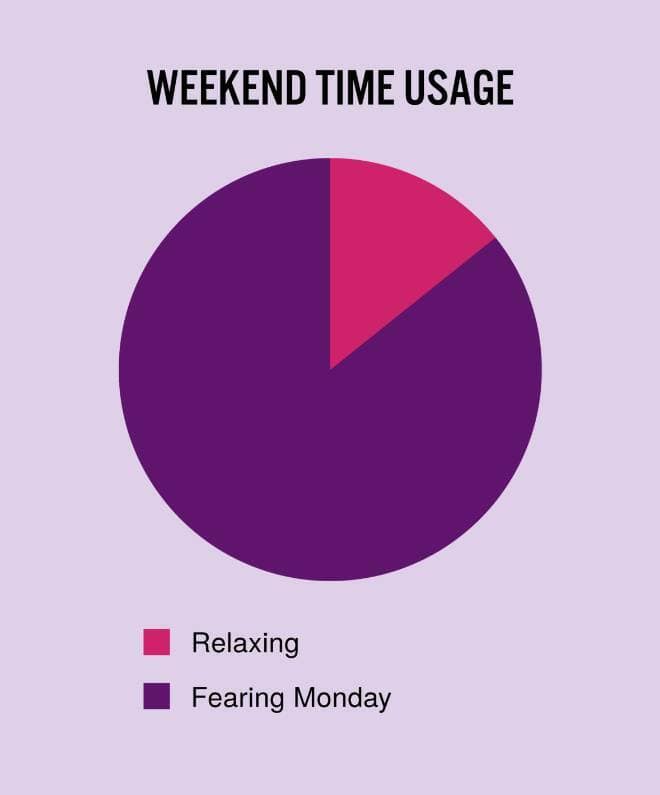
Greetings, chart enthusiasts and those who've never met a pie they didn't want to graph! Today, we embark on a whimsical journey through the world of data representation—the funny pie chart edition. Brace yourselves for 21 slices of hilarity that dissect everyday absurdities with surgical precision. Because when life hands you lemons, why not graph the absurdity of the lemonade-making process? This gallery of laughter-infused pie charts invites you to explore the complexities of everyday life through the lens of humor and data. Delve into the intricacies of procrastination with a pie chart that masterfully breaks down the stages, from initial intentions to the inevitable descent into YouTube rabbit holes. Witness the hilarity of a funny pie chart that reveals the allocation of brain capacity dedicated to remembering obscure song lyrics—spoiler alert: it's a significant percentage. These charts don't just depict data; they unravel the absurdity woven into the fabric of our daily existence. Venture into the world of funny pie charts,f where laughter analytics and absurd data visualization reign supreme. Marvel at the comical graphs that transform mundane routines into mathematical mischief. The percentage of time spent contemplating the meaning of life might be smaller than you think, but the laughter it generates is immeasurable.
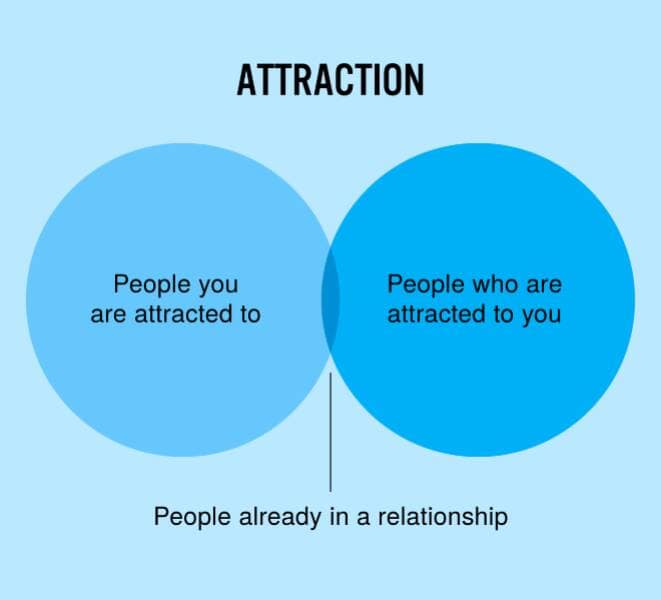
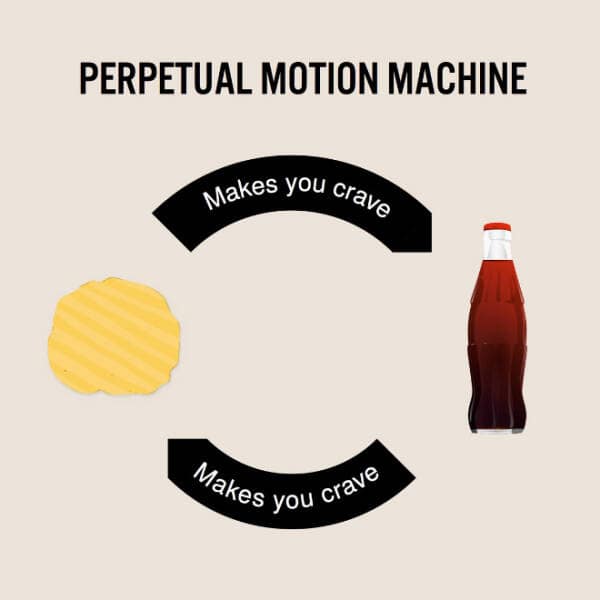
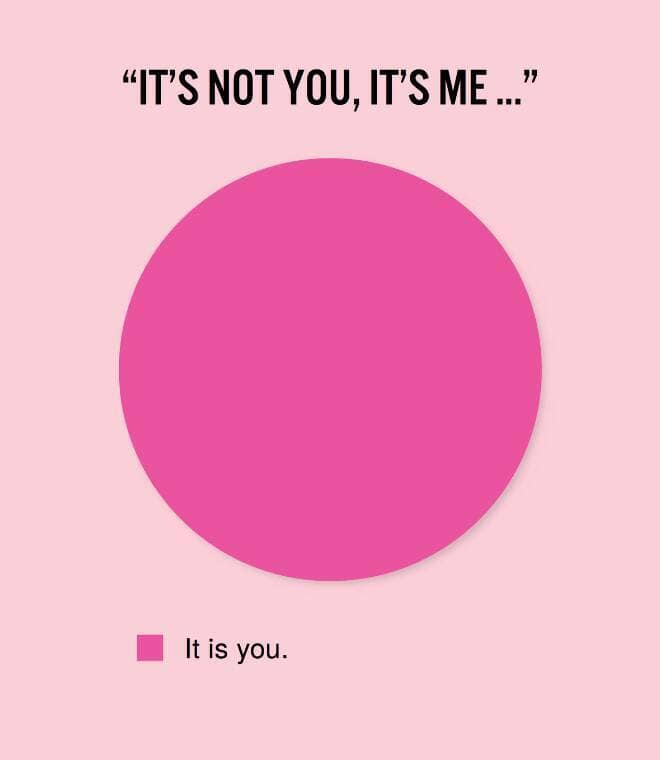





Congratulations, data humor aficionado! You've successfully navigated this funny pie charts labyrinth and emerged on the other side with a newfound appreciation for the statistical side of laughter with these comical graphs. Your ability to quantify the hilarity in everyday scenarios has been refined, and you're now equipped to respond to life's absurdity with a well-crafted pie chart. If the hunger for laughter analytics persists, fear not! Our archives boast an array of bar graphs, scatter plots, and line charts that dissect the humorous nuances of human existence. Dive into the world of amusing graphical analysis or explore the chuckle-inducing charts that await your discovery. After all, laughter is the best data point.
