Interesting Infographics
Updated on November 2, 2025
I was doomscrolling box scores when a clean lineup chart stopped me cold—proof that interesting infographics can teach faster than a wall of text. Ten seconds, one “ohhh,” and suddenly I’m the guy dropping charts in the group chat like a coach with a whiteboard.
This batch leans visual-first: tidy legends, smart color palettes, and axes you don’t need a decoder ring to read. Expect data visualization that answers “so what?” in one glance, charts and graphs you can read at arm’s length, and crisp infographic maps that turn geography into quick aha’s. Think r/dataisbeautiful favorites, newsroom explainers, and museum-style labels that respect your time.
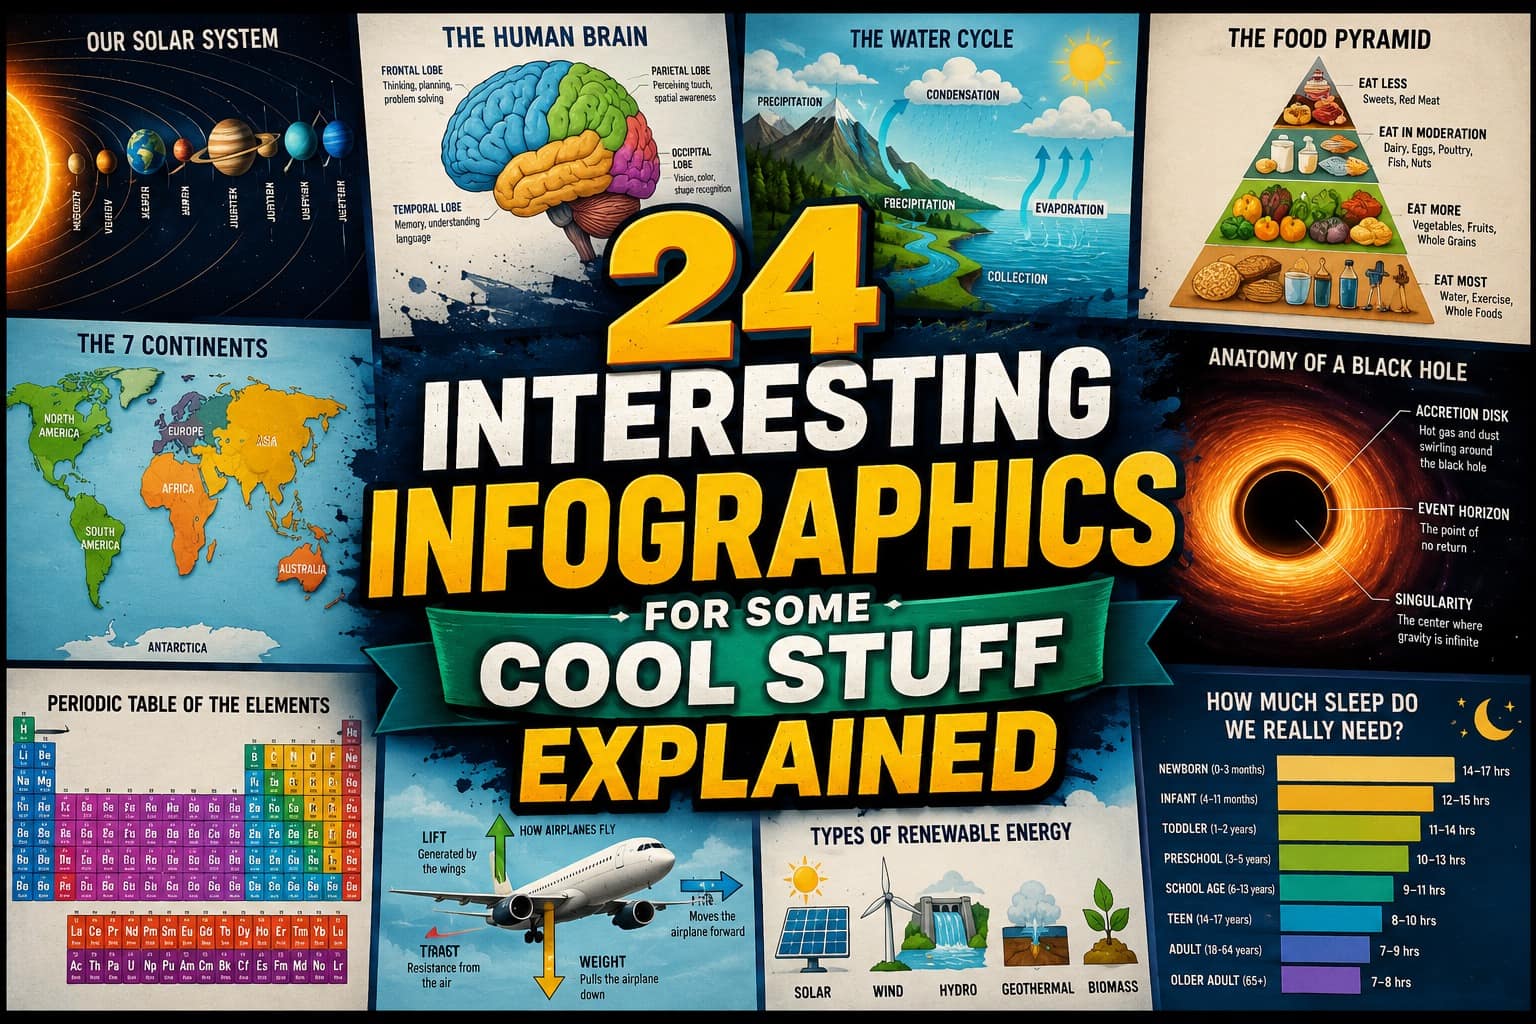
30 Interesting Infographics For Quick Brain Gains
![An interesting infographic map of Asia showing Google autocomplete results for "Why is [country] so..."](https://b3666184.smushcdn.com/3666184/wp-content/uploads/2025/11/interesting-infographics-2-20251101.jpg?lossy=2&strip=1&webp=1)
The fast ones share the same tricks: titles that punch above their weight, scales that behave, and a highlight color that tells you where to look. When you’re saving keepers, tag data storytelling so future-you can find them during a debate you didn’t plan to have before coffee.
Good charts feel like choreography. Bars march; lines breathe; maps whisper “start here.” If a piece makes you zoom in just to admire the labels, that’s designer empathy paying off. For your own posts, keep background noise low and contrast high; the message should survive a phone at 12% brightness. Drop a link note under how to read charts and your DMs suddenly get friendlier.
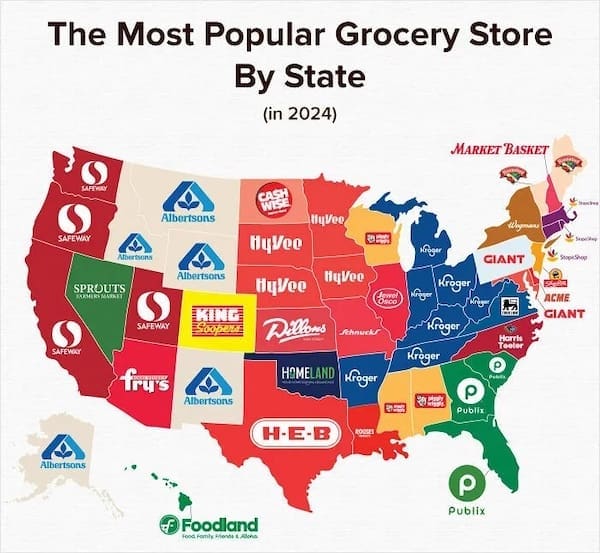
Maps do heavy lifting with small moves. A single state tint can compress a thousand words; a tiny inset can stop arguments about “but the islands.” When a choropleth risks confusion, a dot map or small multiples usually lands cleaner. If you’re building a folder, add a subtag for useful maps—travel plans and trivia nights will thank you.
Numbers behave better with context. Baselines at zero, units spelled out, and labels that prefer verbs over jargon keep charts and graphs honest. Bonus points for annotations that sound like a person talking, not a committee. You don’t need five colors; you need one hero and a supporting cast that stays quiet.
My rule of thumb for shareability: if the thrust fits in a seven-word caption, it’ll travel. “Rent outruns wages in half the city.” “This line is your sleep debt.” “Migration follows the water.” The interesting infographics in this set earn their keep because the caption and the pixels shake hands.
If your curiosity is still pacing from these interesting infographics, you’ll like 30 Data Visualizations That Explain Everyday Life, 40 Cool Maps You’ll Stare At Twice, and 23 Charts And Graphs That Actually Changed Minds—clean follow-ups for when your brain wants more reps.
Jake Parker breaks down stats like a pregame huddle and believes a sharp legend can win overtime.
Read Memes
Get Paid

Jake Parker, known around the web as "Jay," is a digital writer with over 10 years of experience covering internet humor, meme trends, and viral content. Before joining Thunder Dungeon, Jay was the lead editor at MemeWire, where he helped curate memes that broke the internet, including coverage on trends like Distracted Boyfriend, Kombucha Girl, and Bernie Sanders’ Mittens. A self-proclaimed "professional procrastinator," Jay spends his downtime scrolling Reddit and Twitter to stay ahead of what's about to break the internet next.