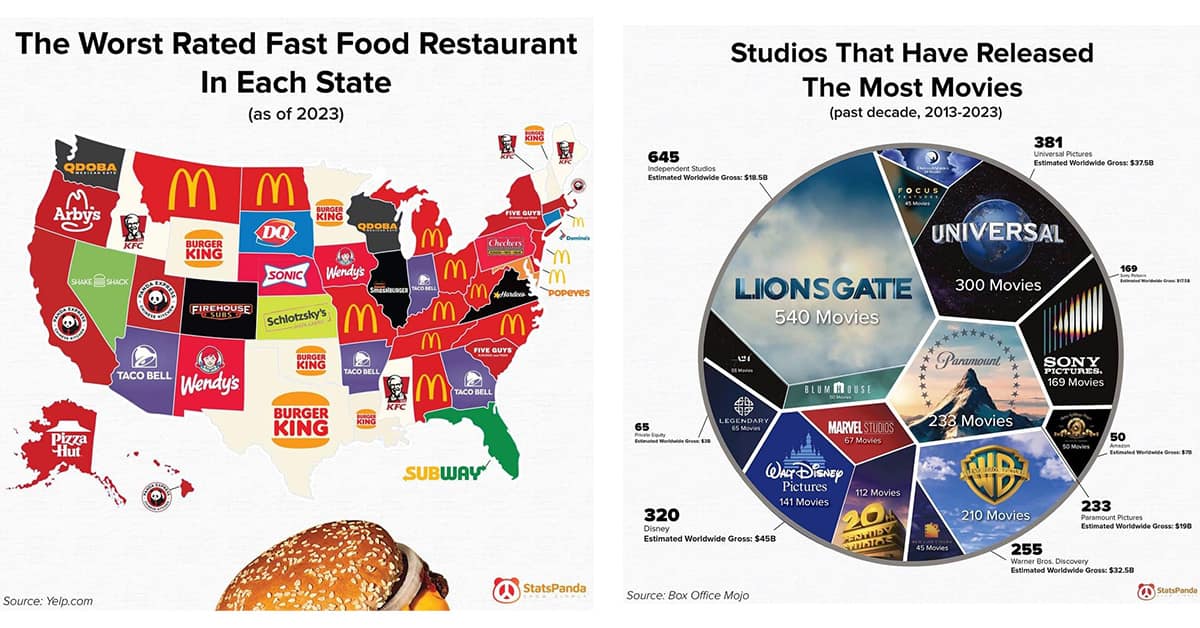
30 Cool Infographics and Interesting Charts For Your Brain
Charts and infographics aren't just tools for conveying dry data—they can also be incredibly funny and engaging. This collection of cool infographics and interesting charts give a little info in the most delightful way. Whether you're a data enthusiast or just someone who loves a good laugh, these visuals are sure to entertain and inform you with their witty take on everyday topics. From intriguing pie charts to clever bar graphs, each infographic provides a humorous perspective that makes complex data approachable and amusing.
Dive into these cool infographics and discover how data can be both informative and entertaining, turning mundane statistics into laugh-out-loud moments. Enjoy the clever blend of humor and insight as you scroll through this collection, perfect for sharing with friends or colleagues who appreciate a good joke wrapped in a smart visual. These charts and infographics will not only make you chuckle but also give you a fresh perspective on how data can be presented.


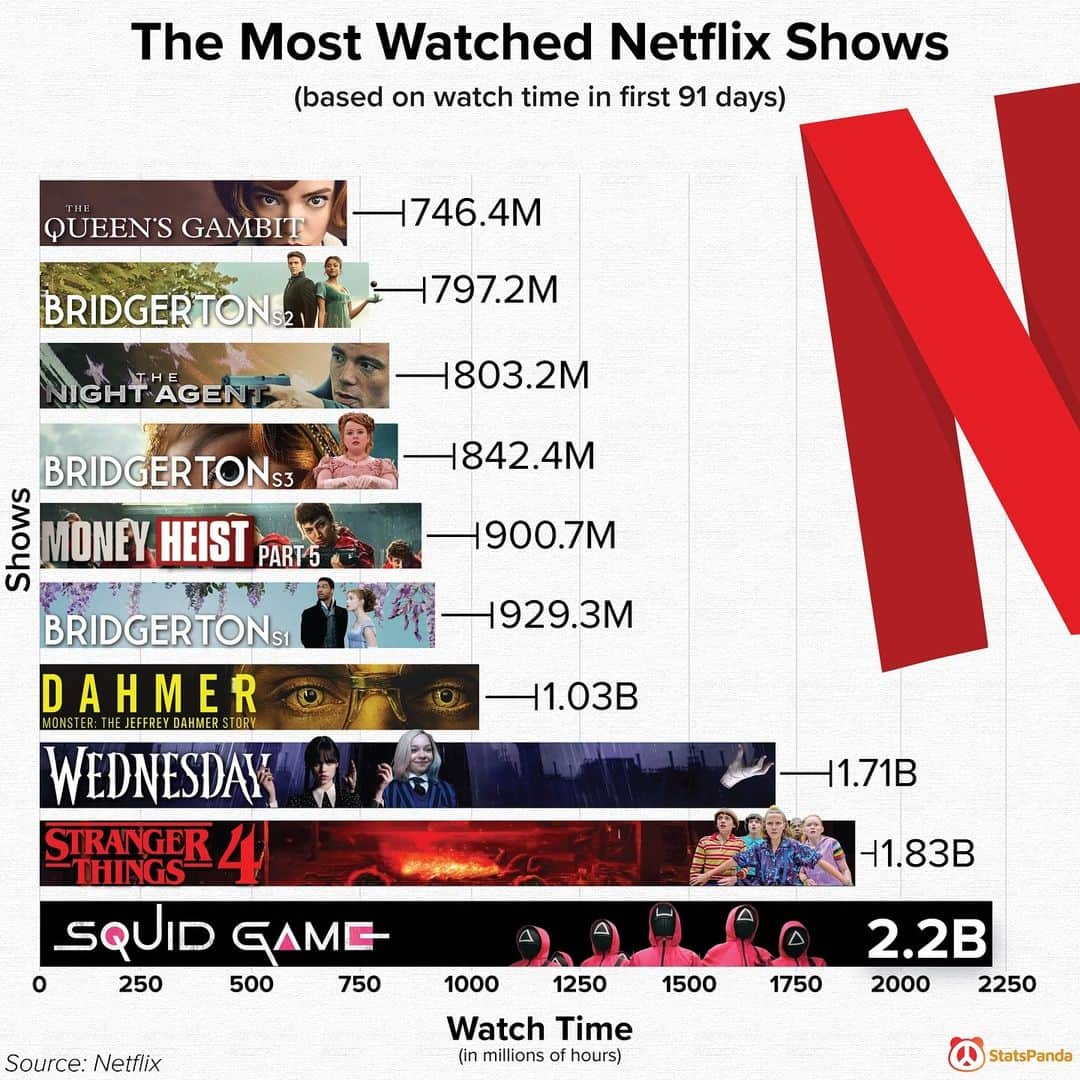
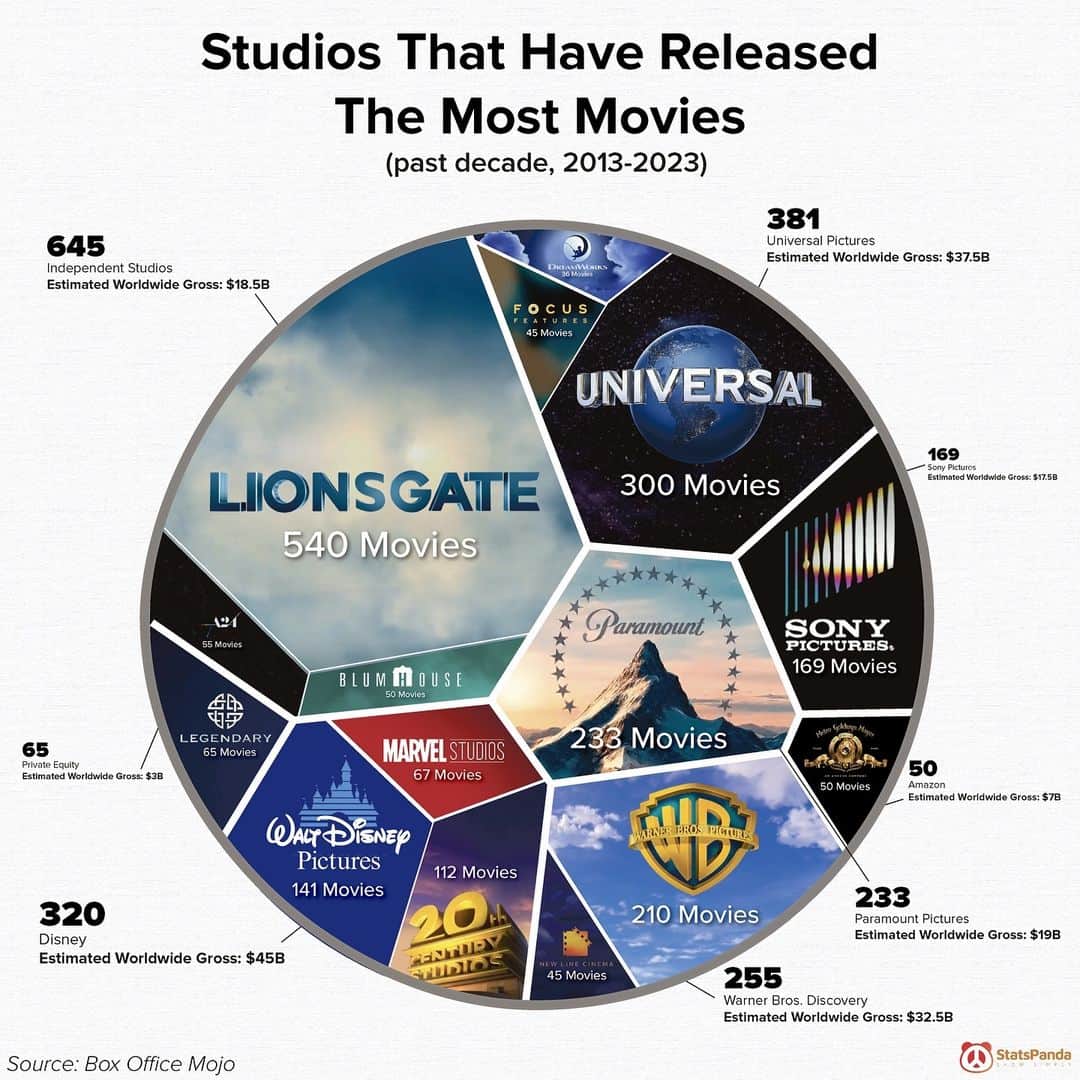


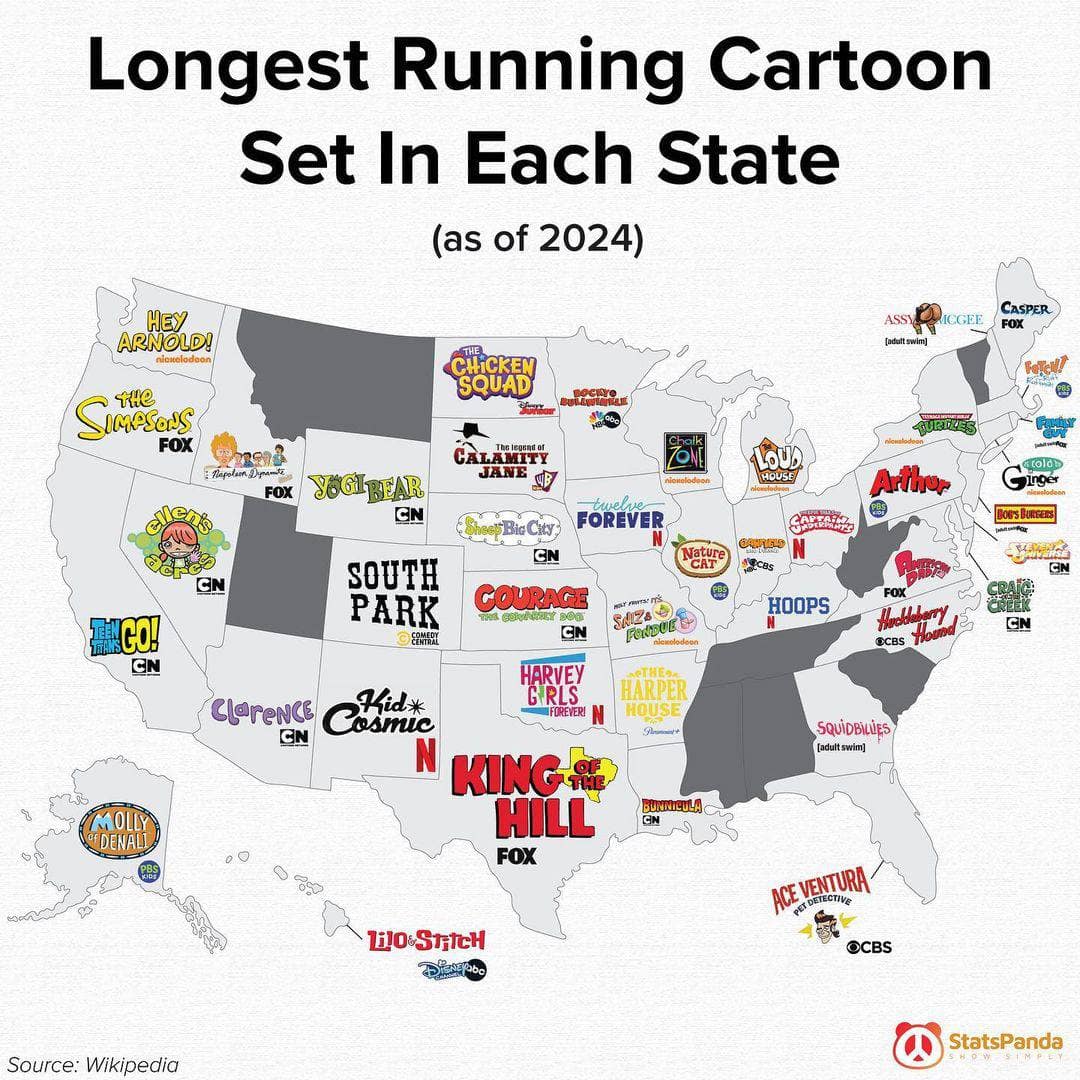






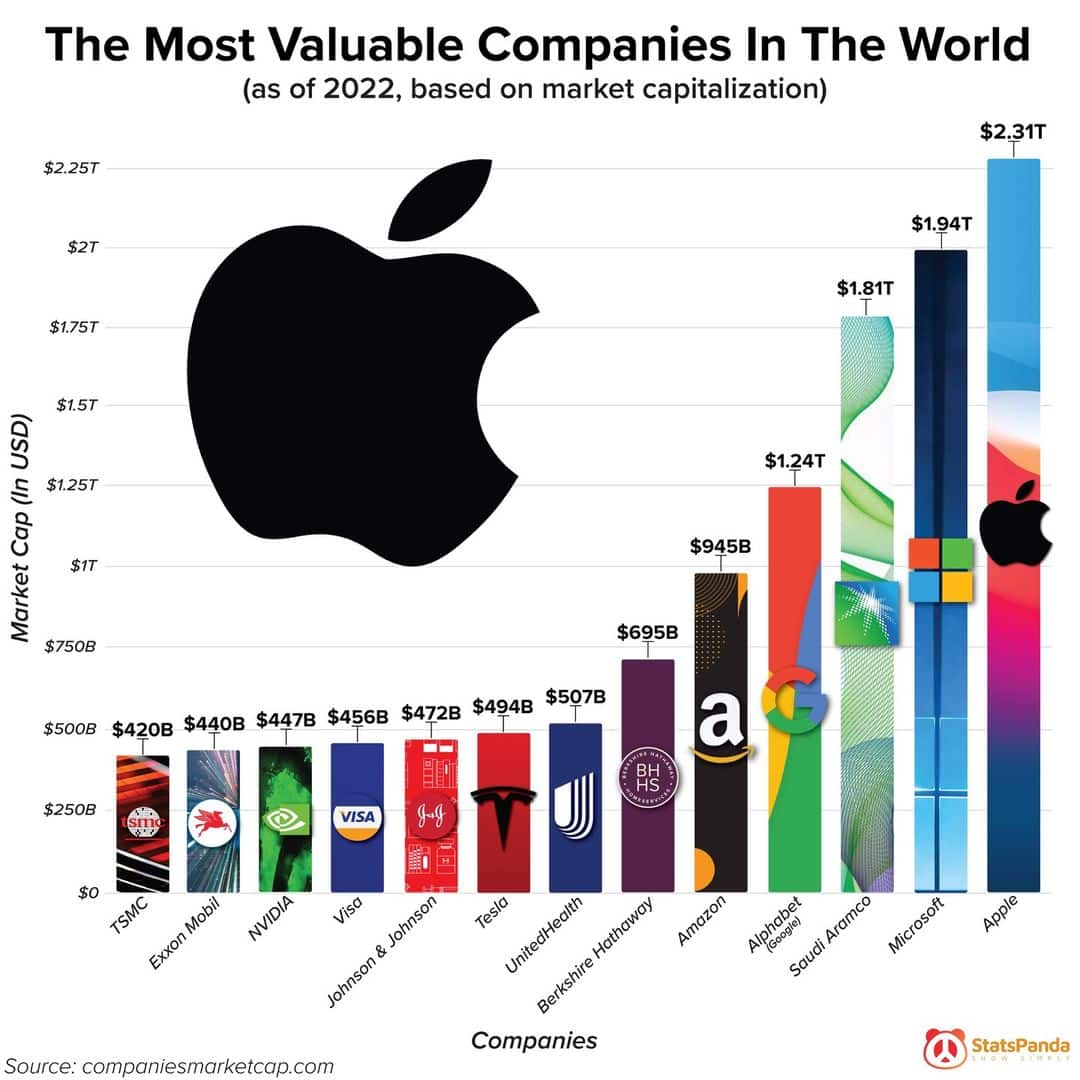

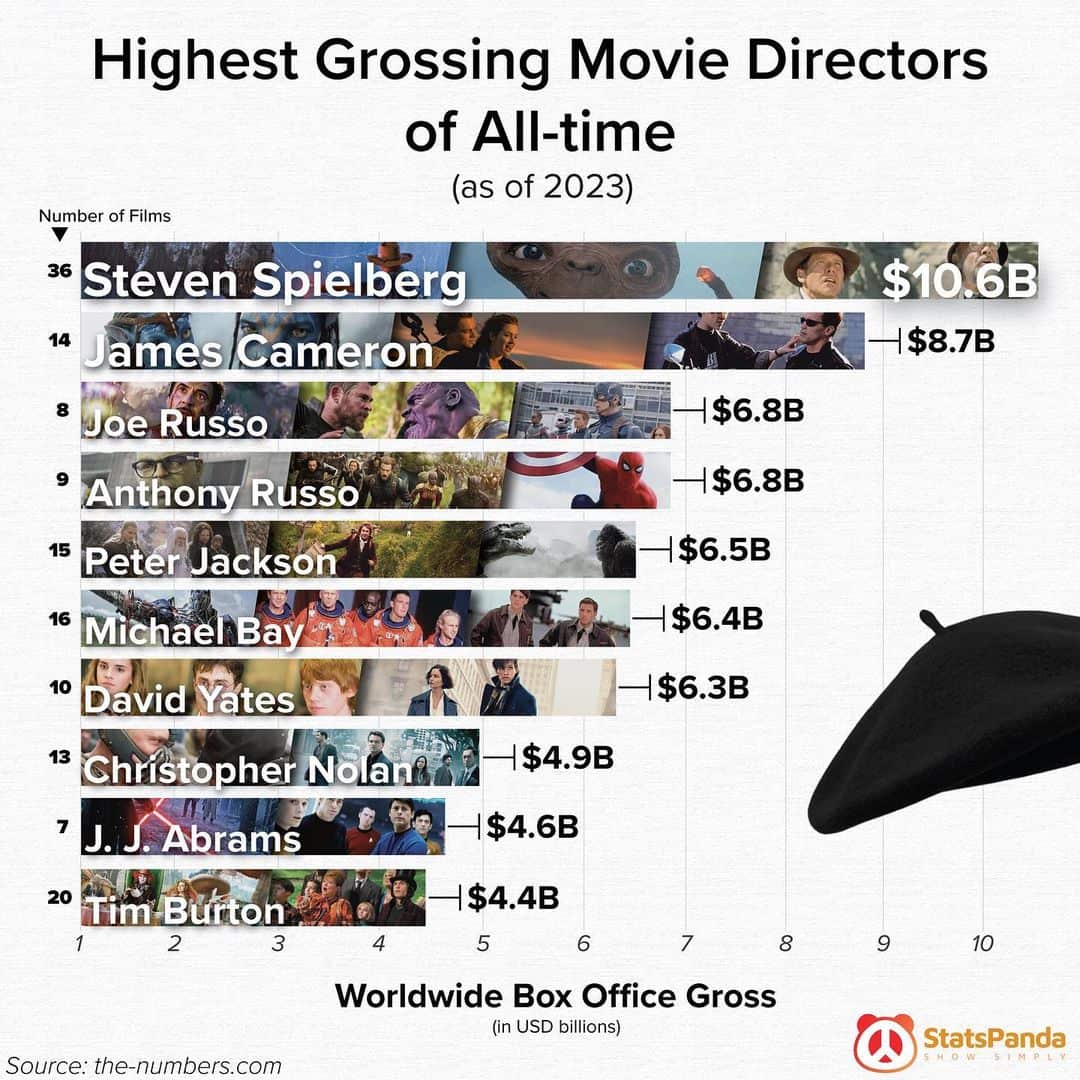

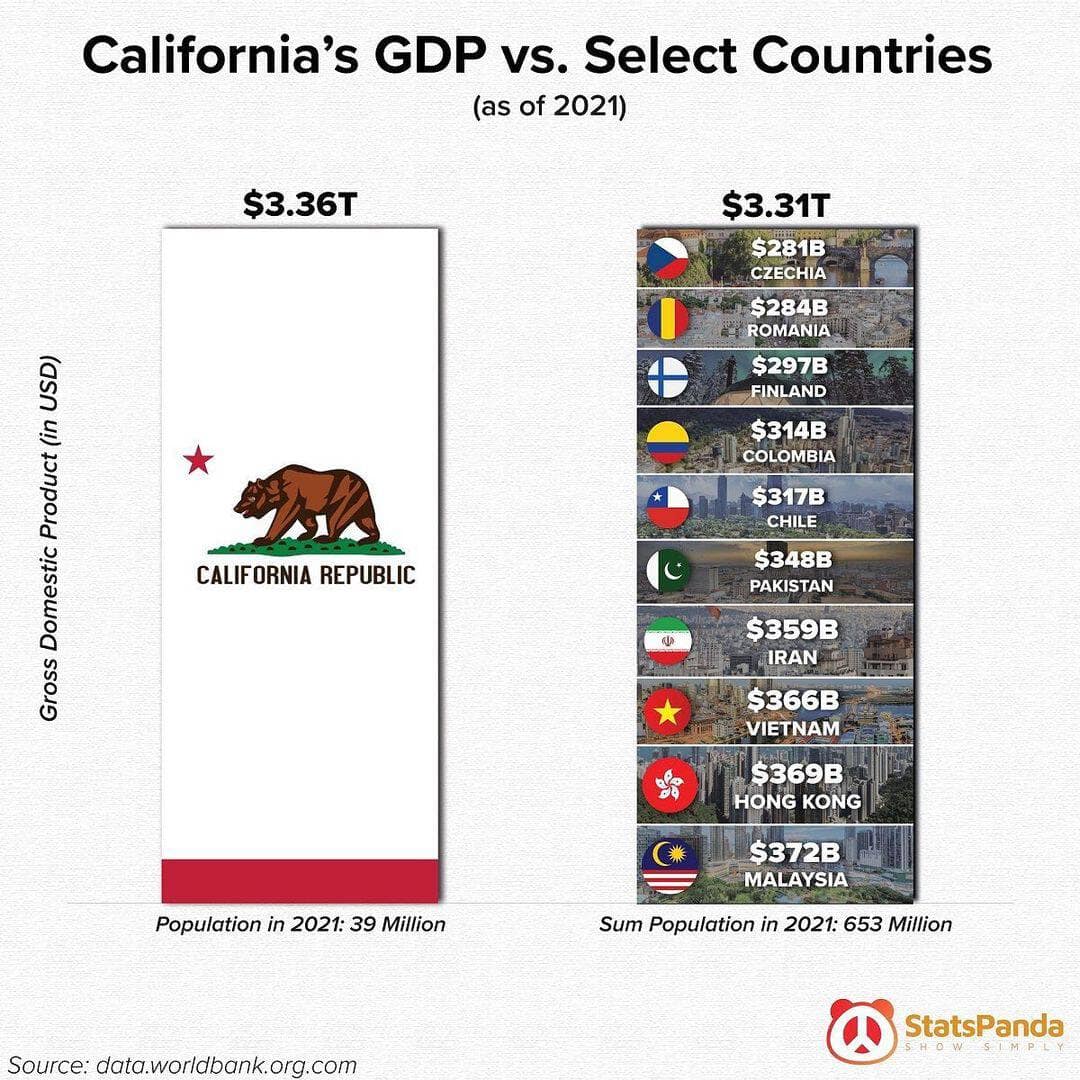
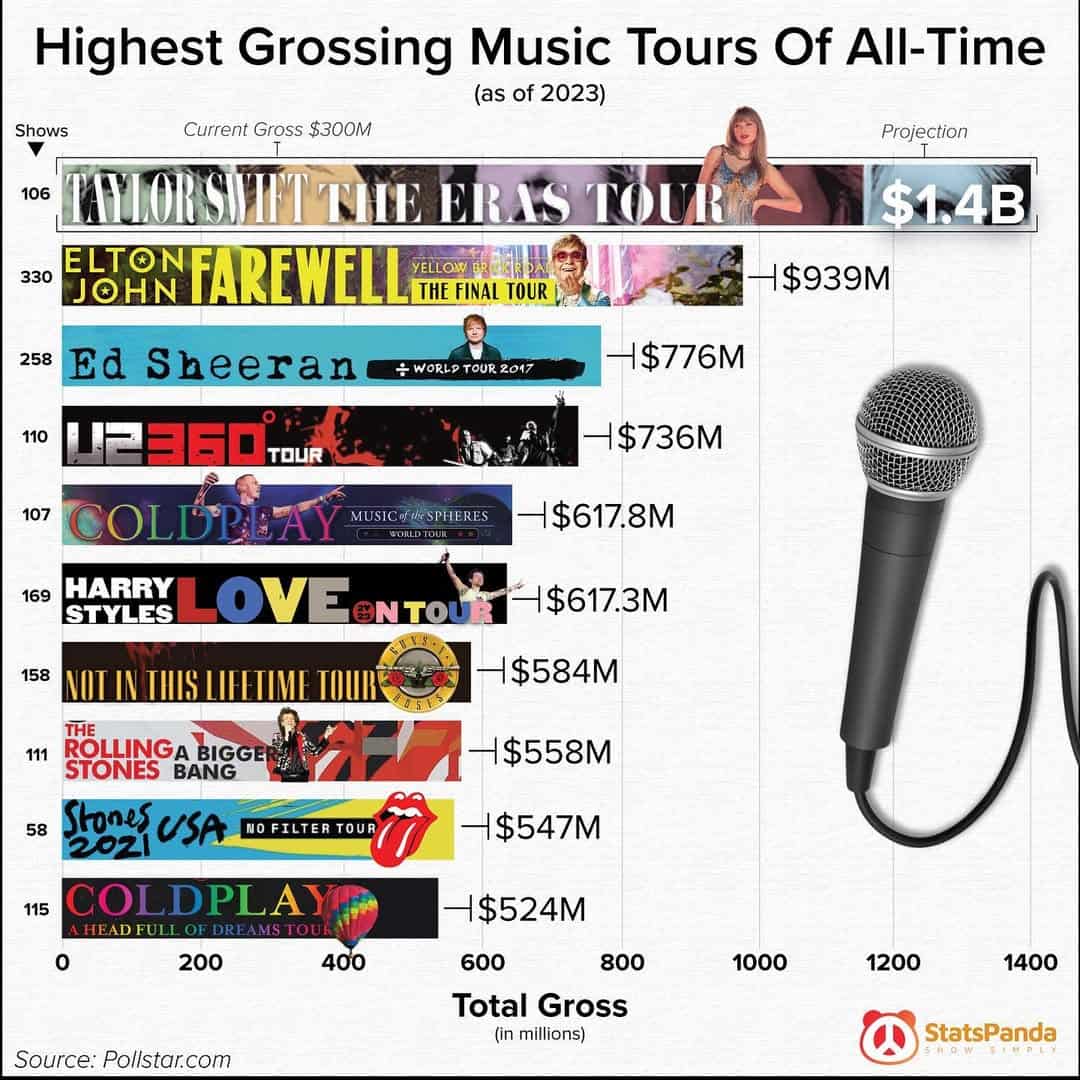
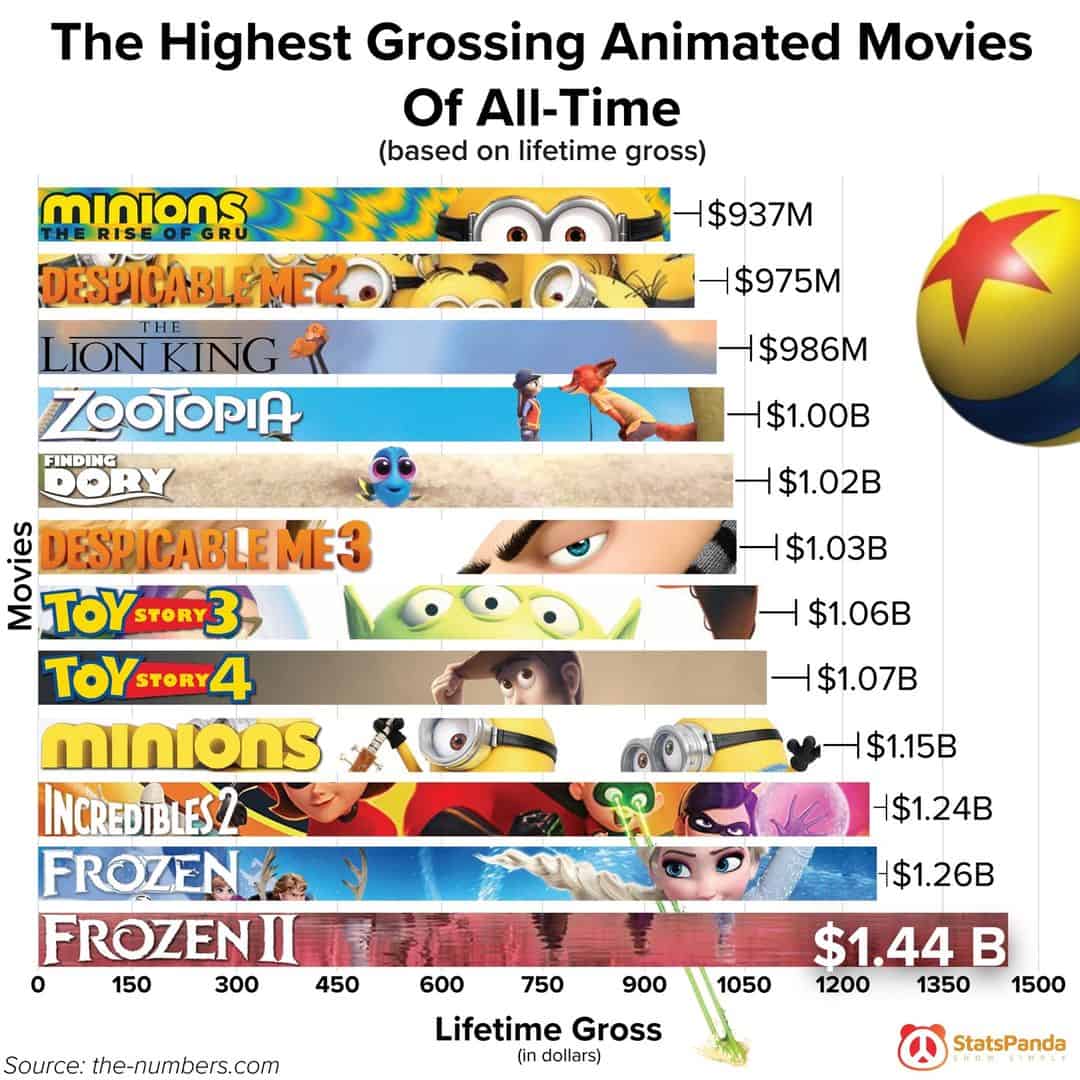
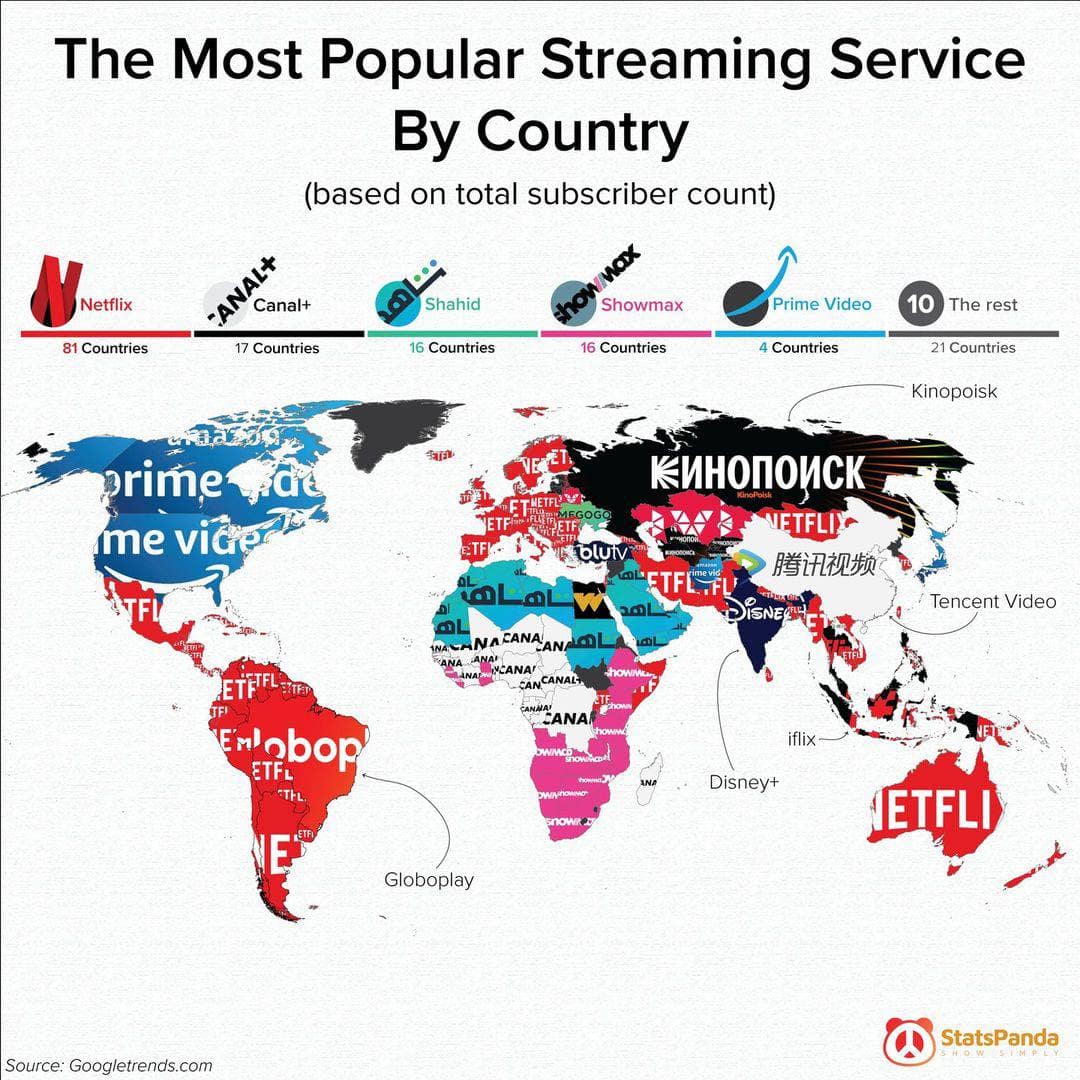
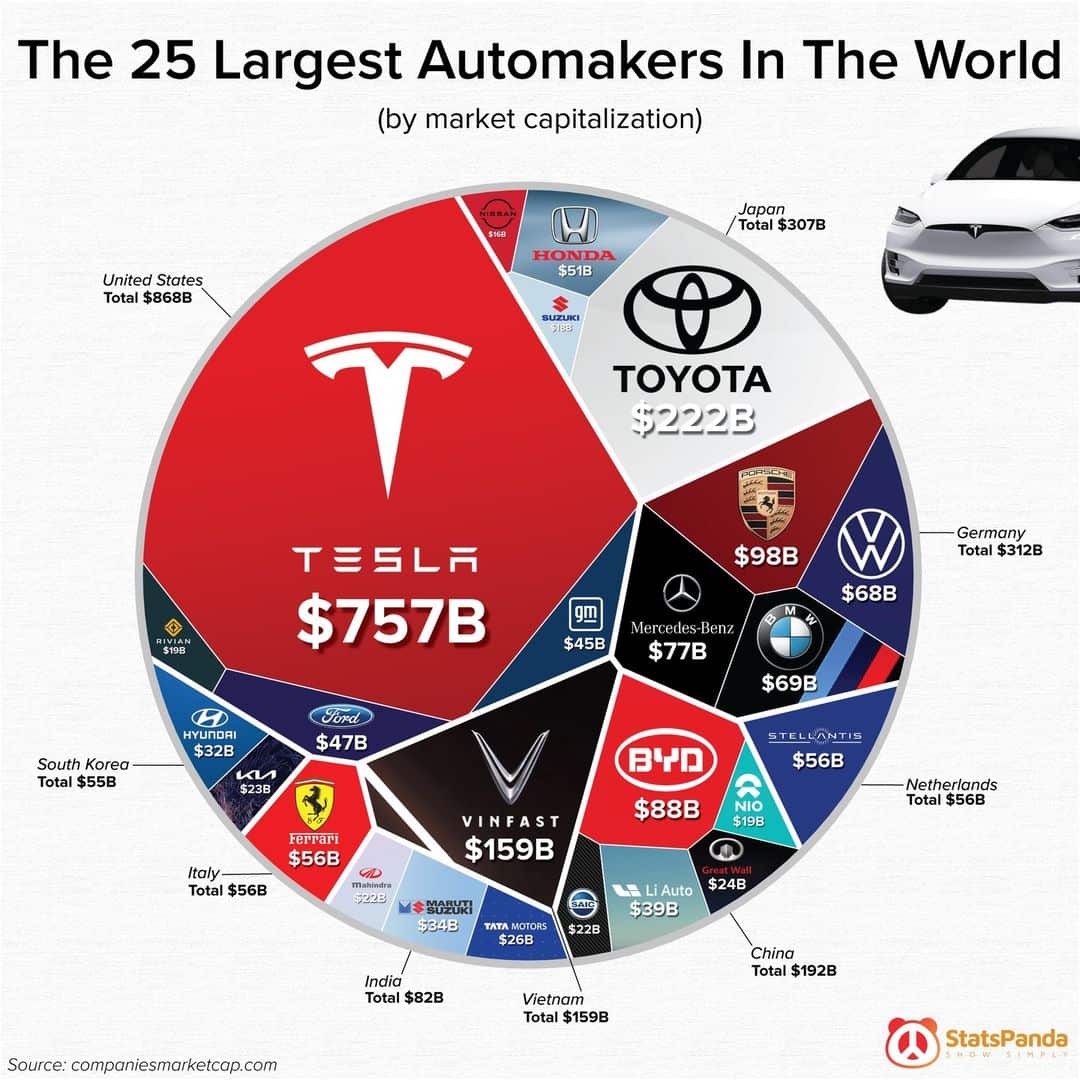




After scrolling through these 30 cool infographics, you likely found yourself laughing and learning at the same time. Each visual brought a unique and humorous perspective to everyday topics, making data fun and relatable. By the end, you probably wanted to share these charts and infographics with friends and colleagues, enjoying the blend of humor and information.
If you enjoyed these cool infographics, there’s more visual humor to explore. Check out posts featuring funny data visualizations, and other content that brings humor to information and technology. These posts continue to highlight the lighter side of interesting charts, providing plenty of laughs and insights. Keep enjoying the humor in charts and infographics, and stay tuned for more visuals that entertain and inform. Until next time, keep laughing and learning! Or don't. We are a blog, not cops or whatever.
