Funny Charts
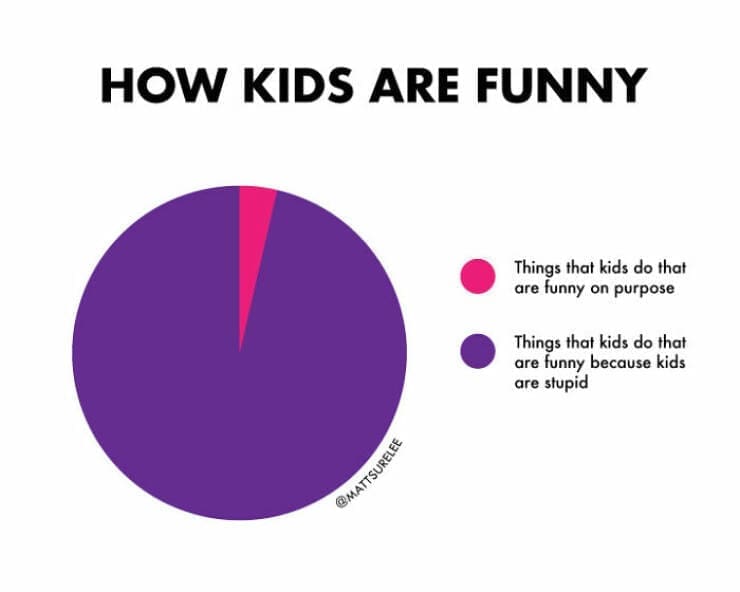
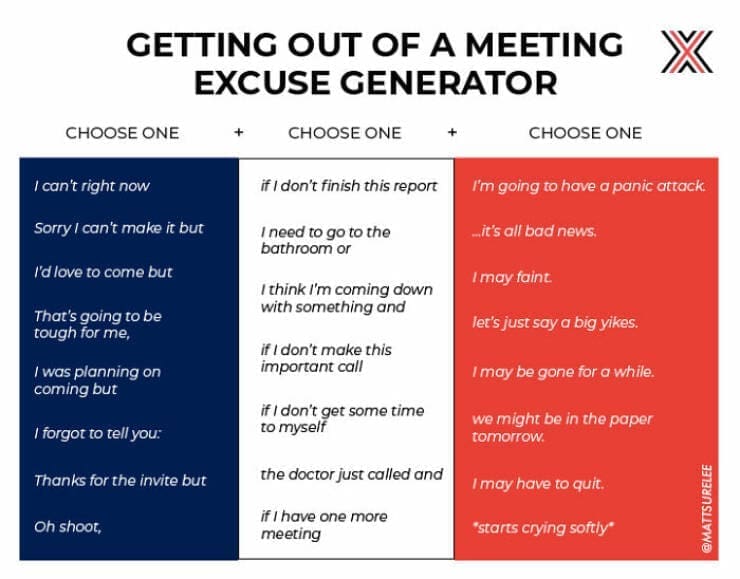
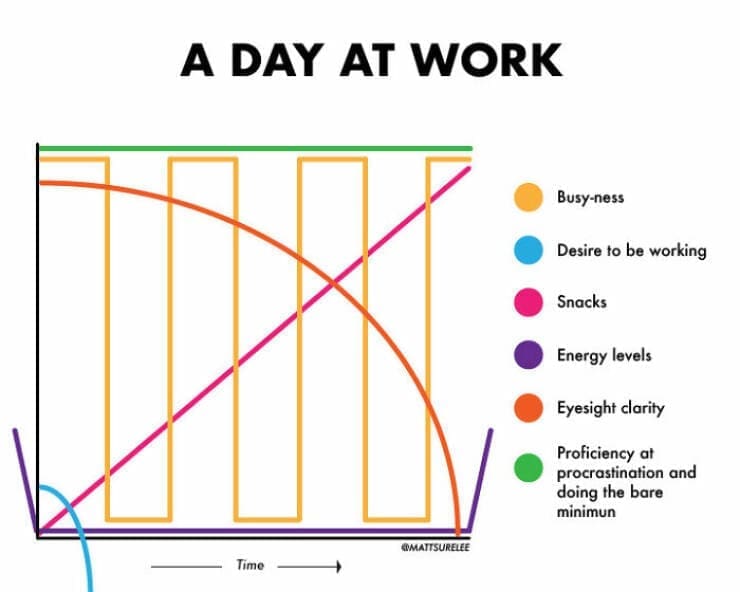
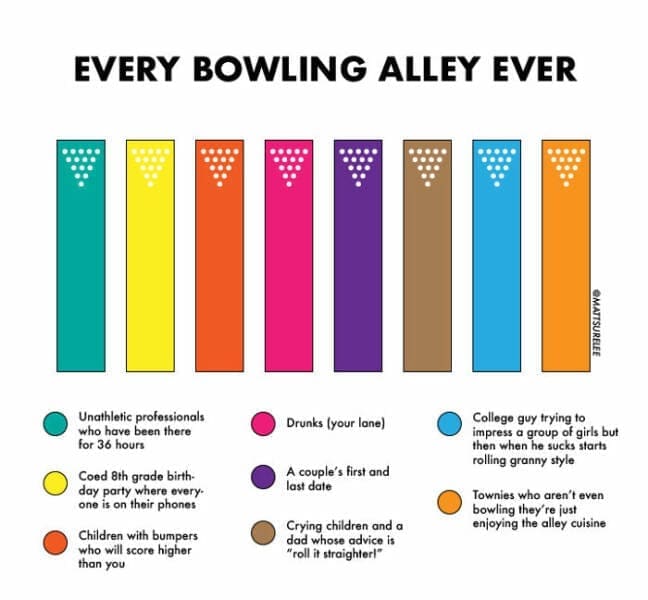
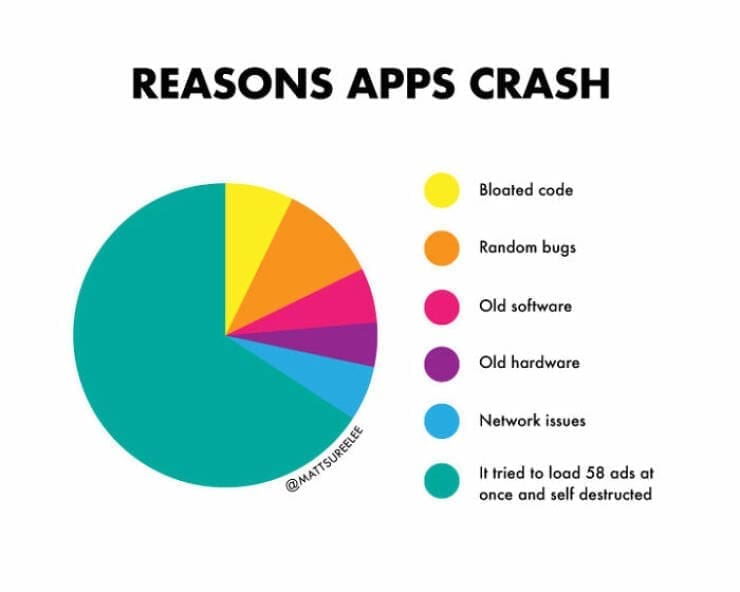
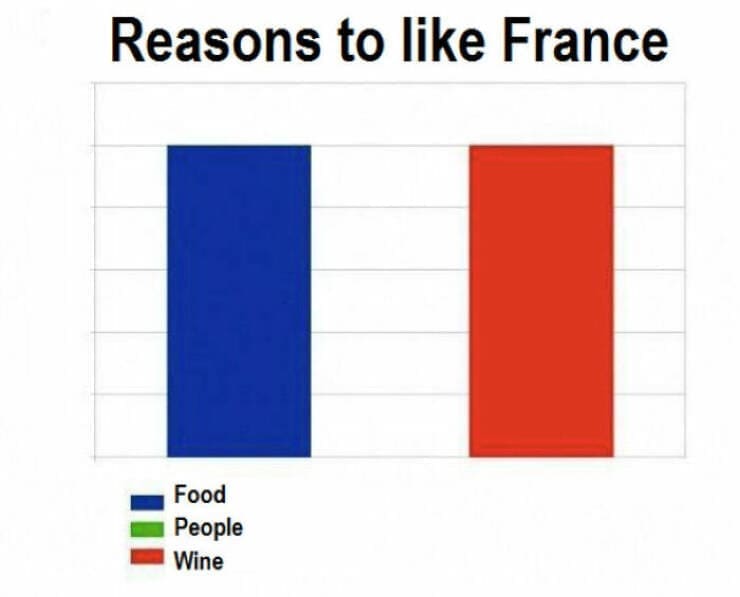
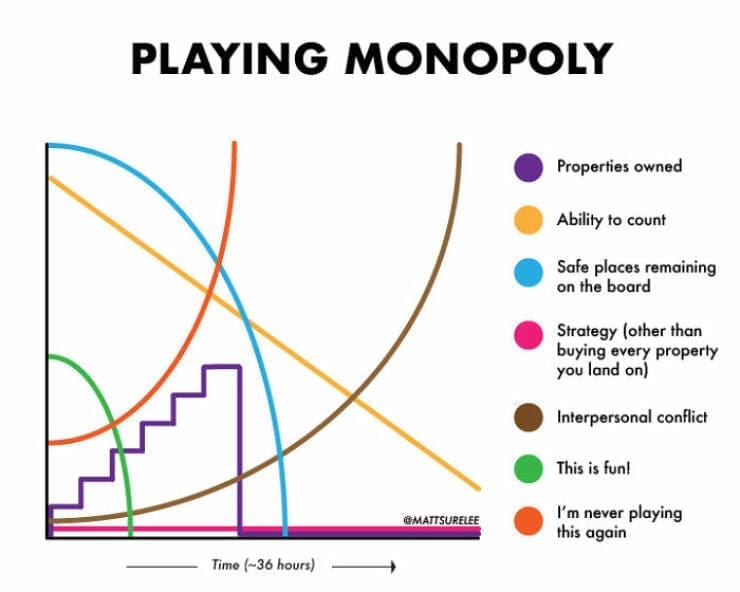
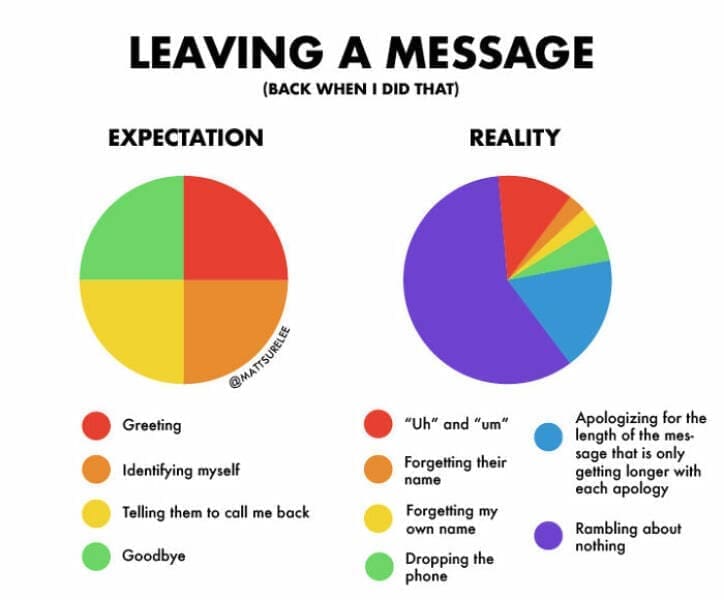
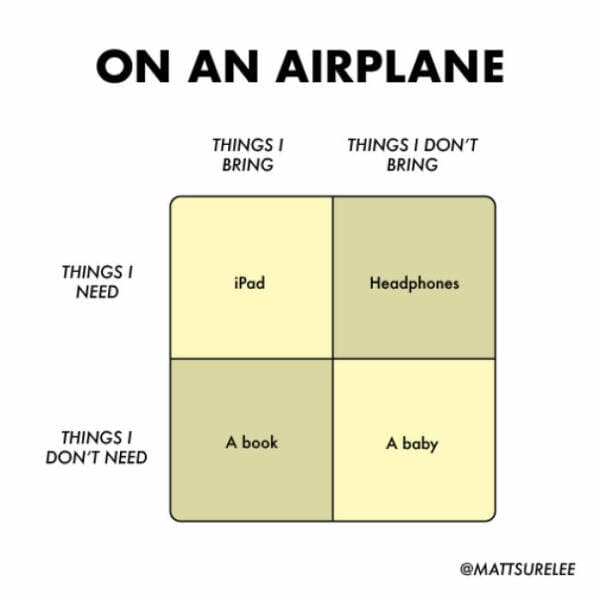
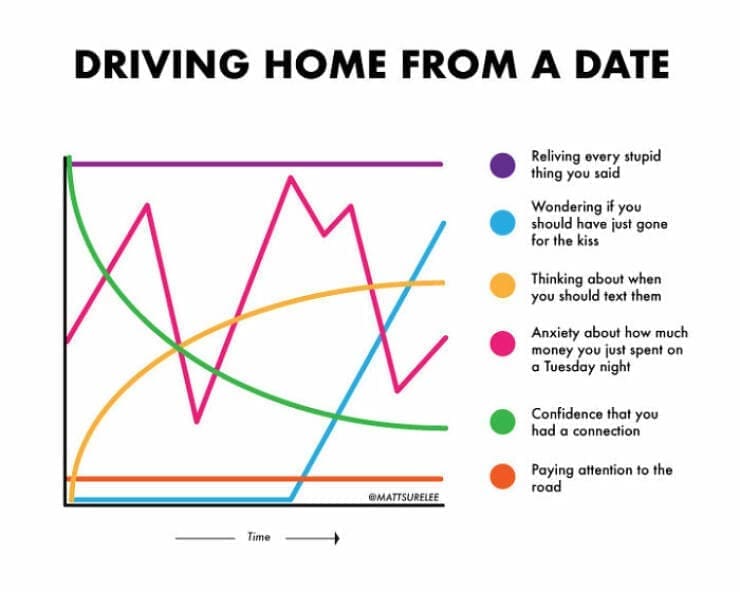
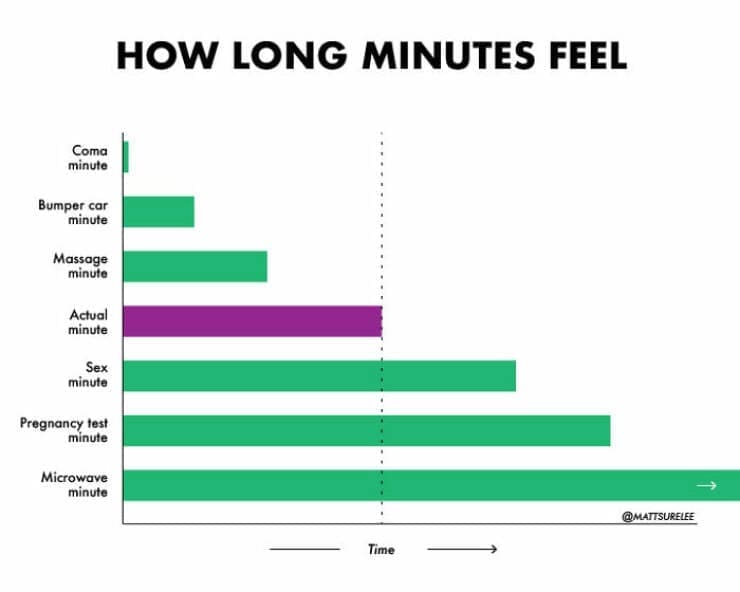
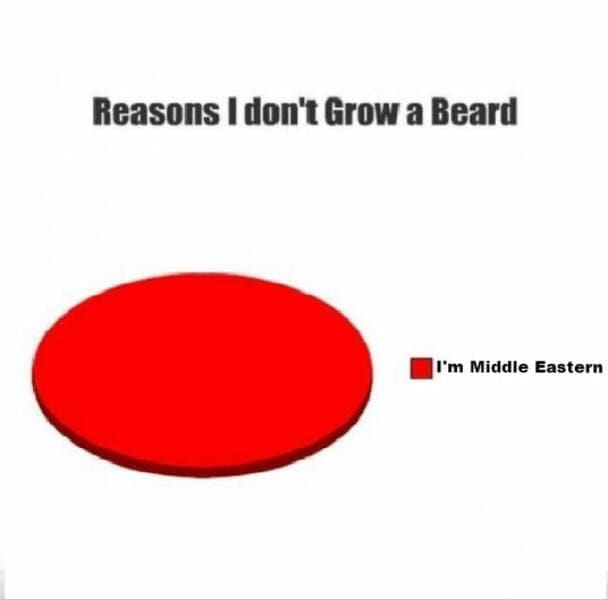
Ever stumbled upon a chart so absurdly funny that you couldn't help but burst into laughter? Get ready to experience 40 of the most side-splitting infographics and charts ever created. From pie charts gone rogue to graphs that defy all logic, these visual masterpieces are sure to tickle your funny bone. It's like stumbling upon a treasure trove of hilarity, where every data point is a punchline waiting to be discovered.
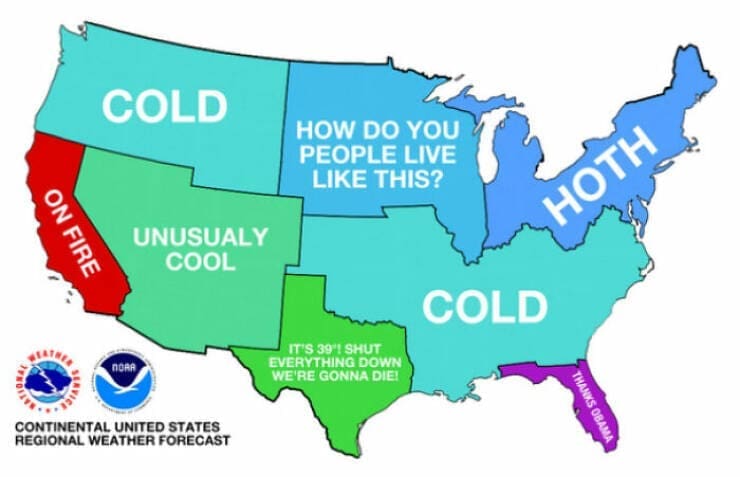
Prepare for a journey into the world of data-driven humor as we present the funniest charts and infographics ever conceived. These visual representations of everyday life will have you laughing out loud as they hilariously skewer common scenarios and human behavior. Each chart is a comedic gem, offering a unique perspective on the absurdities of modern life through the lens of data visualization.

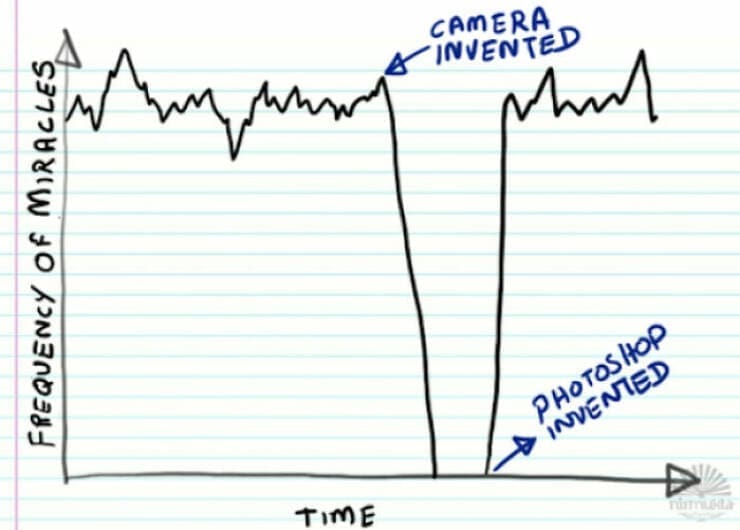
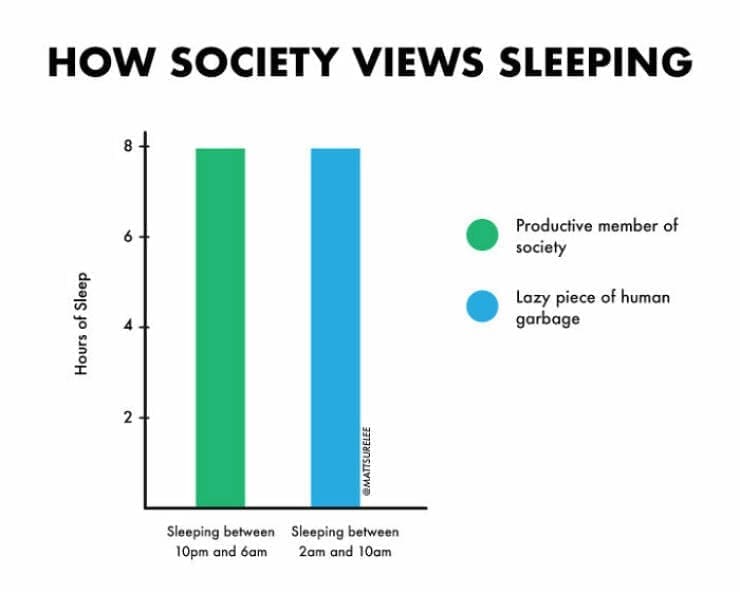
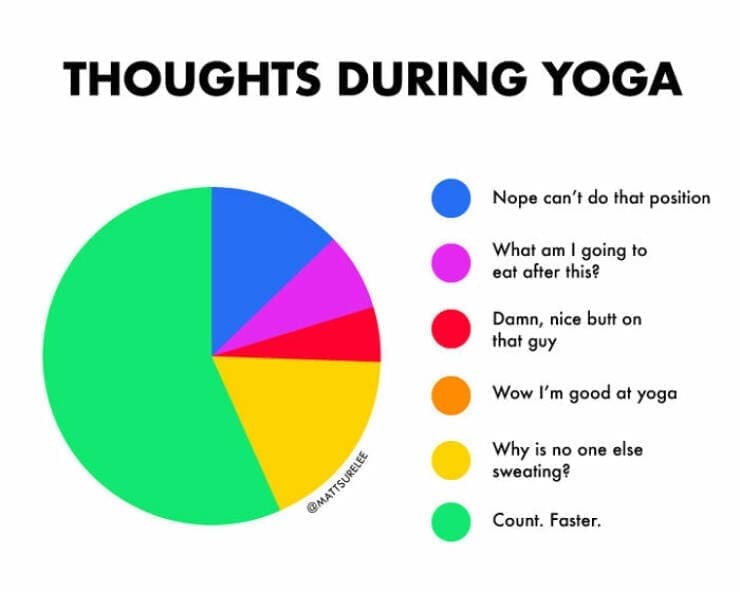


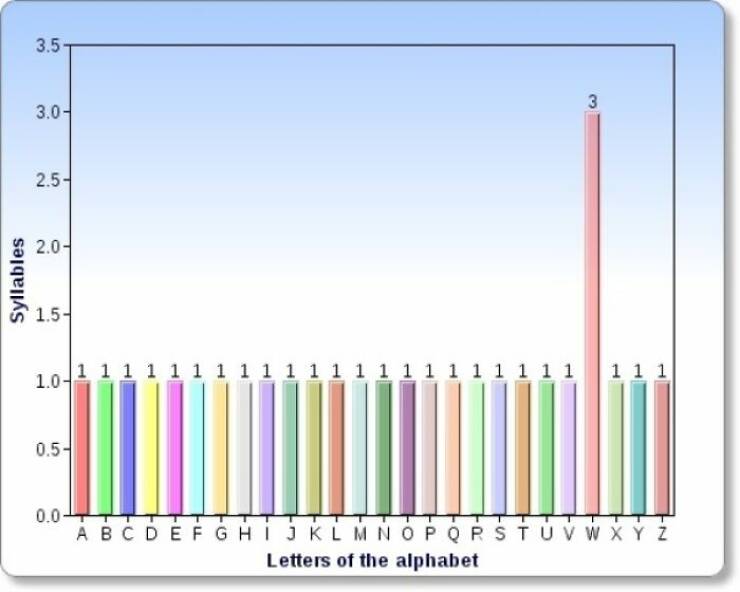

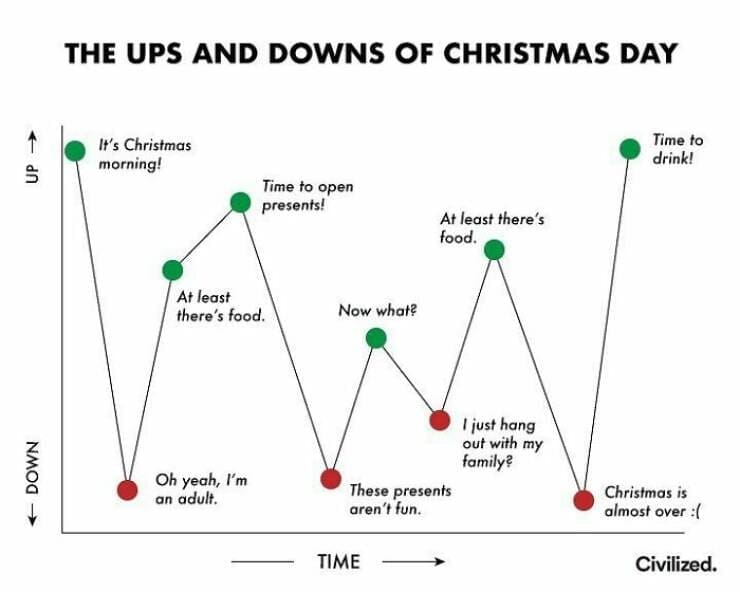

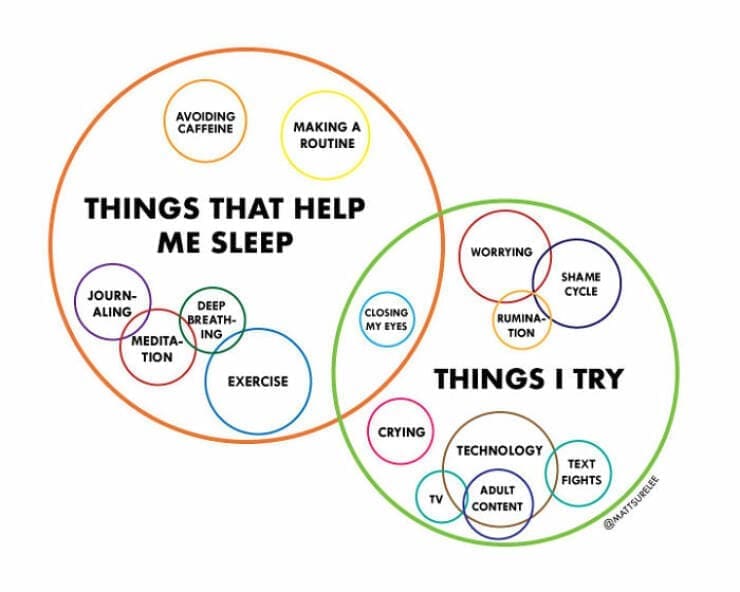
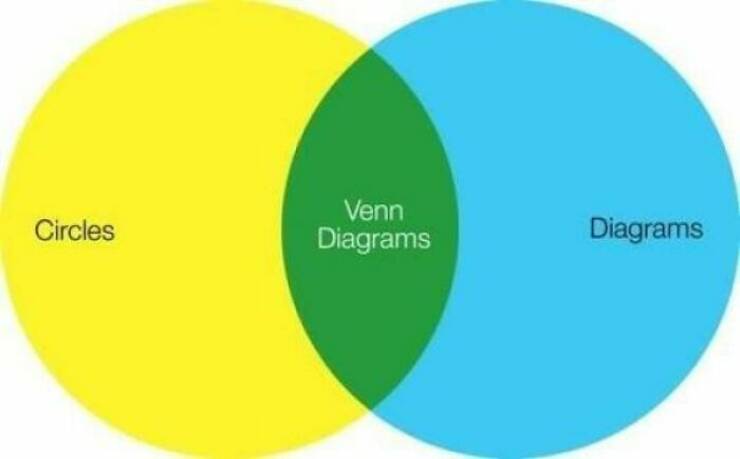


Dive into the world of humorous data visualization and prepare to be entertained like never before. As you explore these comically absurd charts and infographics, you'll find yourself nodding in agreement and chuckling at the sheer absurdity of it all. It's like taking a hilarious detour through the world of statistics, where every graph tells a story – albeit a hilariously nonsensical one.
Hungry for more data-driven humor? Check out our collection of laugh-inducing content for even more charts, graphs, and infographics guaranteed to put a smile on your face. Whether you're a data enthusiast or simply love a good laugh, there's something here for everyone. So grab your magnifying glass and get ready to analyze the funnier side of life with our collection of witty visualizations.
Read Memes
Get Paid

Roy R., Chief Meme Curator
Roy founded Thunder Dungeon in 2012 and has since guided its growth into a 2.5 million‑strong community of meme enthusiasts. With over a decade of digital‑media experience and a nose for viral humor, Roy oversees content strategy, ensuring every post is both hilarious and high‑quality